Introduction
Urinalysis is the third major diagnostic screening test in the clinical laboratory, only preceded by serum/plasma chemistry profiles and complete blood count analysis (1,2). For decades, microscopic urine sediment analysis has been the gold standard (3). The introduction of new technologies and automation has improved the accuracy and productivity of the process (4). On the other hand, consolidation of laboratories has increased the physical distance between patient and laboratory, which creates a major preanalytical challenge. It is mandatory to focus on the preanalytical phase in order to improve the reliability of test results (5) and to lower the costs of health care (6). In the clinical laboratory, total quality could be defined as the guarantee of a correctly performed activity throughout the total testing process, providing valuable medical diagnosis and efficient patient care. Improvements in both reliability and standardization of analytical techniques, reagents and instrumentation have contributed to a remarkable 10-fold reduction in the analytical error rate over the last 30 years. Furthermore, also progress in information technology and quality assurance methods have contributed to a further reduction of diagnostic errors. Nevertheless, the lion share of errors in laboratory diagnostics (and in urinalysis in particular) falls outside the analytical phase; both preanalytical and postanalytical steps are much more vulnerable (7).
Various subphases have been identified in the preanalytical phase of urinalysis. Need for the test, collection and transport of the sample to the laboratory, receipt of the specimen by the laboratory and sample preparation and transport to the proper laboratory section for testing (8) can be important potential sources of error. As more effort needs to be spent in the preanalytical phase for the further reduction of errors (9), in the present paper we give an overview of the preanalytical challenges of urinalysis.
Patient preparation and sampling procedures
The laboratory is responsible for correct information regarding optimal patient preparation and best sampling procedure. Interpretation of test results is only possible when these conditions are fulfilled. Informing the patient goes far beyond only explaining the practical aspects of urine sampling. More specifically, the effect of possible biological confounders such as dietary intake, diuresis, exercise and other interferents,should be emphasized. If necessary, illustrated instructions for sampling can be provided (10). Despite the existing guidelines, the importance of a proper preanalytical procedure for collecting urine specimens is usually not known by the patients. In a recent paper, Miler et al. showed that a 24-hour urine sample was not properly collected in more than half of the informed outpatients, which were often older (mostly > 65 years) and suffering from a chronic disease. The prescribed instructions were not followed, some volume of the urine sample was discarded or an improper container was used. To decrease the number of errors in the preanalytical phase, laboratory staff, general practitioners and patients should be educated and an active promoting of the preanalytical procedures by the laboratory staff should be encouraged. In case of an incorrect sample procedure, the urine collection should be repeated (11).
The quality of the reported results could also be influenced by variables in specimen processing. Sample preparation is more essential for different particle analysis techniques in comparison with urine test strip analysis and microbiological culture. As an example of the importance of interferents, the influence of commercially available baby soaps on tetrahydrocannabinol (THC) immunoassays can be mentioned. Beyond healthcare, newborn drug screening plays also an important role in the legal domain. Mixtures of drug-free urine with various products that commonly contact newborns were tested using immunoassays. Addition of variable commercially available baby soaps to drug-free urine resulted in a measurable response in THC immunoassays. Due to the presence of surfactants with the THC assay, soap and wash products used for newborn and infant care can potentially cause false positive screening test results, leading to involvement by social services or false child abuse allegations (12).
Which precautions should be implemented?
Minimizing contamination can already be achieved by implementation of simple precautive measures. A 20% reduction of the number of false positive urine cultures can be achieved by washing the glans penis of men or the introitus of women (10,13,14). Due to the influence on the viability of bacteria, the use of soap or antiseptics is not recommended (10,15).
Which sampling procedure to choose for urinalysis?
A large amount of sampling procedures is available with specific advantages and disadvantages. When deciding the best procedure, one should take into consideration the patient’s characteristics (suspected microorganisms or presence of a urinary catheter). Sample quality can only be warranted if standardized instructions for urine collection are available (10,13). Clean-catch urine or midstream portions of first morning urine samples collected in a sterile urine container are the most commonly obtained specimens in routine practice. However, overnight bacterial growth in the bladder is likely, which can affect casts and cells. Morphological studies showed a higher reproducibility when incubation time was ± 1-2 h. Therefore, using second morning urine specimens is sometimes recommended (urine samples voided 2-4 h after the first morning urine) (16). In a recent multicenter study (17), results obtained from first-voided and mid-stream urine samples were compared. In healthy subjects, two consecutive samples of the first morning micturition were collected by a vacuum system, the first from the first-void and the second from the mid-stream. Routine urinalysis was performed using dip-stick automated analyzers and automated particle analyzers. Counts of epithelial cells, erythrocytes and leukocytes, but not for casts were significantly higher in the first-voided samples. A significantly higher count of epithelial cells, erythrocytes and leukocytes was also observed between females and males in first-voided samples, whereas no significant difference could be found in mid-stream samples. Overall prevalence of subjects with cellular elements count exceeding upper reference limits was also higher in first-voided than in mid-stream samples. Mid-stream urine was confirmed as the most appropriate sample, since the presence of contaminating elements, such as bacteria, analytes and formed particles are minimized (10).
The European Confederation of Laboratory Medicine (ECLM) has proposed a classification of reference measurement procedures for urine measurements. Different levels of accuracy have been defined (level 1-4). Level 1 represents rapid or screening methods, amenable to point-of-care testing, often with an ordinal scale result. Some may be suitable as screening methods for larger laboratories if specificity, sensitivity, or both are high enough. Level 2 has been defined as methods suitable for routine laboratories; many of them will be automated or could be automated in the future. Level 3 represents the ‘‘State of the art’’ methods whose performance is satisfactory enough for purposes of comparison. Finally, level 4 stands for best methods (primary reference measurement procedures = reference and definitive methods). Based on those guidelines, erythrocytes and leukocytes can be examined by strip examination (level 1), standardized urine sediment (level 2) or advanced chamber counting (level 3); albumin and other proteins can detected by strip examination (level 1), quantitative field measurement (level 2) or accurate measurement traced to the CRM 470 protein standard (level 3); bacterial analysis should be performed by dipslide culture (level 1), culture with a 1 µL disposable loop for 24-48 h (level 2) or quantitative titration of 10-100 µL inocula on two different [cysteine lactose electrolyte deficient medium (CLED) and haematin] agar plates (level 3) and urine volume rate (diuresis) could be analysed by strip examination (level 1), creatinine and refractometry (level 2) or quantitative measurement of osmolality (level 3) (18).
Which sampling container is preferable?
Collection of urine specimens is a major source of preanalytical variability. A sterile collection is mandatory for bacteriological culture of urine samples. Urine collection container design should enable easy sampling, ensuring an optimal transport and allowing sensitive detection of pathogens. Furthermore, they should be free of interfering agents and made of non-absorbing materials, with no influence on any analyte. The collection volume should be determinant factor for the size of the urine container. Additional requirements may be needed in function of diagnostic procedures (e.g. light sensitive analytes as porphyrins and urobilinogen require amber-colored urine containers) (8,10). The original primary sample should be divided into different smaller aliquots for morphological, microbiological and chemical analyses to decrease the risk of contamination. Easy filling from primary containers without risk of spillage should be one of the characteristic of secondary containers. These transparent tubes preferably have a round bottom, which allow a better resuspension of the sediment following centrifugation (10).
For reducing the risk of errors and contamination, commercially available vacuum systems have been developed, allowing direct sample aspiration into a secondary container. Vacuum systems can only be used for chemical analysis and are not recommended for particle analysis. During vacuum aspiration, the pressure difference results in a desintegration of brittle casts. Vacuum aspiration is responsible for a significant reduction of hyaline and cellular cast counts (respectively at least 58% and 51%) in comparison with conventional test tubes (4). The reduction of cast counts depends on the vacuum during aspiration (19). A destruction of cellular casts (which are only weakly hold together by the sticky Tamm-Horsfall protein) is observed due to mechanical damage during vacuum aspiration, with a release of their cellular inclusions, as demonstrated by an increased amount of erythrocytes and leukocytes. Erythrocyte counts in urine specimens were higher (> 25% increase) in vacuum tubes than in conventional tubes (4). At this moment, only particle analysis will result in true identification of casts. The available assays measuring Tamm-Horsfall protein can provide information on the presence of casts, without verifying the nature of the casts. The influence of vacuum systems on other elements is limited. No difference in flowcytometric erythrocyte count and the percentage of nonlysed erythrocytes has been observed for urine samples with normal osmolality (conductivity) in conventional and vacuum test tubes. However, the erythrocyte count and the percentage of nonlysed erythrocytes in vacuum tubes were lower than in conventional urine tubes (minimum 20% and 31% reduction) in samples with low conductivity. Peroxidase-based haemoglobin dipstick reactions were comparable. Because of the growing importance of (micro)albuminuria in the diagnosis of kidney disease, more attention has been paid to the particular preanalytical aspects of this analyte. At low albumin concentrations, adsorption to the surface of urine containers can lead to marked relative losses (20). Nonspecific adsorption of urinary albumin was calculated at < 1 mg/L with hydrophilic surfaces and < 2 mg/L with nonhydrophilic surfaces. Binding to surfaces may also result in protein denaturation. Addition of nonionic detergents or using hydrophilic surfaces may reduce both adsorption and denaturation. Albumin is relatively stable at the air-liquid interface when rapid mixing generates foaming. Frozen storage at temperatures above -80 °C (particularly at -20 °C) produces various modifications to the albumin molecule (21).
Transport and preservation
Is it a matter of time?
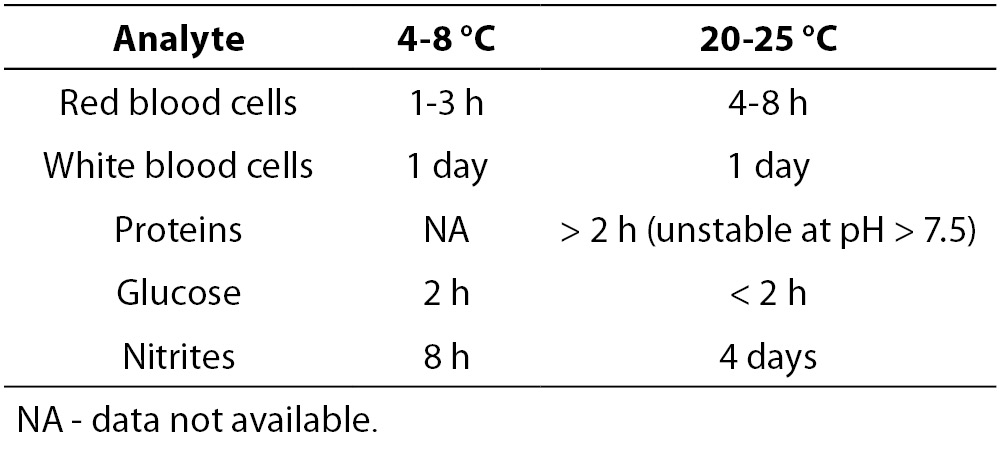
An increased time lag between sampling and analysis, a lack of temperature control and a lack of addition of a preservative to samples for which urinalysis cannot be performed within two hours of collection, will lower the quality of urinary test results. Table 1A and 1B give an overview of the stability of different particles and test strip parameters (22). The exact sampling time and delays exceeding the specified limits should be documented. Point-of-care analyses are not subject to this delay, but may as well be affected by various analytical issues.
Table 1A. Influence of temperature on stability of particle analysis (adapted from reference 21).
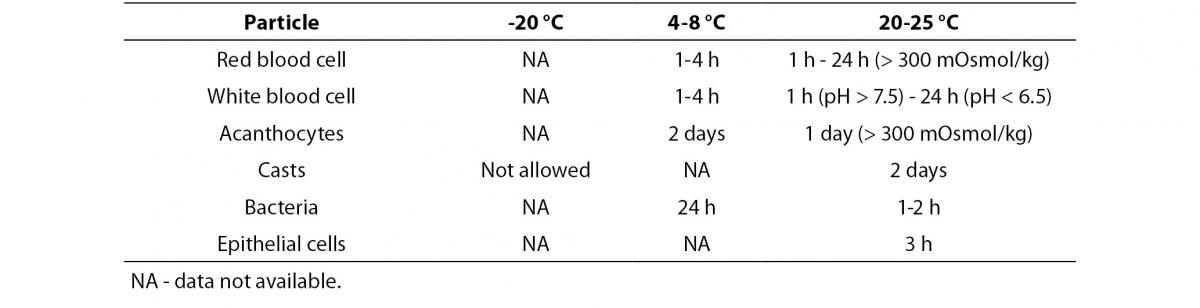
Table 1B. Influence of temperature on test strip analysis (adapted from reference 21).
Use of preservatives: why, which and when?
Alkaline pH, low relative density and low osmolality can induce a rapid lysis of some urine particles after collection (22). Addition of stabilizers usually prevents metabolic changes of urine analytes and overgrowth of bacteria. In a recent study, the value of transport tubes containing a preservative for maintenance of the semiquantitative and qualitative assessment of urine cultures was again demonstrated, especially in cases when the sample transport time > 2 h (23). However, preservatives may affect some chemical properties and alter the appearance of particles. An appropriate label carrying a hazard symbol should give information dealing with any preservative (10,13,22). Risk of sample dilution and its potential influence on outcome of urine culture are important issues when using liquid mixtures.
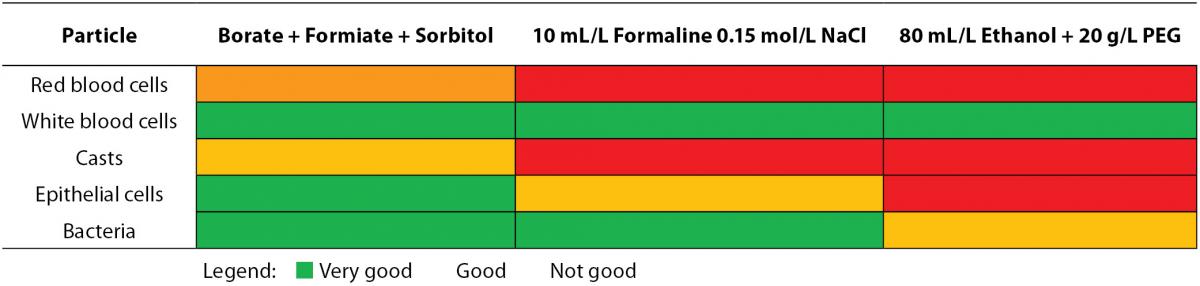
The correct preservative to specimen ratio should be respected when samples are preserved for transport and analysis (8). The recommended specimen volume is mostly indicated on the container with a marking line. If too much sample is added to the container, the concentration of the preservative gets too low, reducing the preservative action. In the inverse situation, an excessive amount of preservative may inhibit bacterial growth. The minimal urine volume needed in order to obtain correct results has been determined for two different preservative-containing systems (24). Traditionally, ethanol (50%) is selected to preserve cellular particles, although only a partly prevented lysis of red and white blood cells is observed. Addition of polyethylene glycol (20 g/L) to the ethanol fixative (Saccomanno’s fixative) improves preservation quality (10,25). Lyophilised formulations should be chosen among the commercial preservatives as there is no risk of sample dilution of spillage. Also, containers supplemented with boric acid alone or in combination with formic acid or other stabilizing media, are used (10,26). Table 2A depicts the effect of commonly used preservatives on flow cytometric particle analysis. In contrast to casts, epithelial cells and leukocytes, the stabilization of erythrocytes is extremely difficult, probably due to cellular shrinkage following the addition of formaldehyde solutions (25).
Table 2A. Influence of preservatives on particle analysis by flow cytometry.
In function of the required testing, a difference in preservative demands is requested. In particular, laboratories should focus on the analytical test quality, as more reliable results ask for stricter preanalytical demands. Several specific proteins are instable in urine, which could be resolved by inhibition of their degradation by the addition of some preservatives. Although the 24-hour urine collection is the reference method for quantification of stable chemical analytes, contamination, incorrect collection and incorrect calculation of urinary volume can cause preanalytic errors. The albumin: creatinine ratio (or protein:creatinine ratio) on a random urine sample, which is not influenced by variation in water intake and rate of diuresis, is a recommended alternative (27). Correlation between protein:creatinine ratio and 24-hour protein excretion may not be accurate for proteinuria levels > 1 g/L. For monitoring proteinuria, the reliability of protein:creatinine ratio still needs to be proven (9,22).
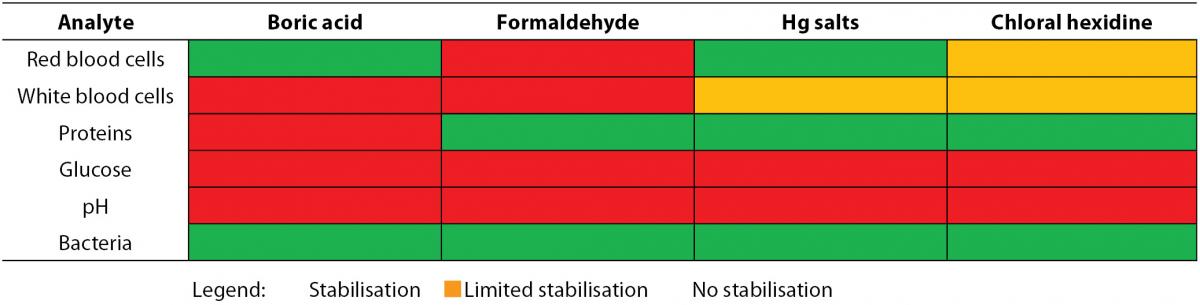
When analysis of the test strip can be performed within 24 hours and the urine specimen has been refrigerated, no preservatives are needed (10). Freezing cannot be regarded as an alternative for refrigeration in preserving samples for urine test strip analysis. The selection of the preservative partly depends on the required analyses since some enzymatic reactions may be influenced by preservatives (Table 2B) (10,26,28). The use of boric acid affects a number of test strip reactions. This limits the proposed combination of test strip analysis and urine culture to obtain an optimal diagnostic test use. Boric acid keeps urinary pH below 7, prevents dissolution of pus cells (29) and is associated with false negative strip test results (e.g. protein, white blood cells and ketones). A multicenter study showed a successful preservation of most test strip results as long as 6-24 h (nitrite and glucose were the exceptions) using the preservative-containing BD Plus C&S plastic, BD Plus UAP (BD Diagnostics-Preanalytical Systems, Franklin Lakes, NJ, USA) and Greiner Stabilur tubes (Greiner Bio-One, Kremsmünster, Austria) (28). Although it cannot be considered as good laboratory practice, in some laboratories dip slides are put in a urine containing test tube while using the same sample for other types of analyses. Several reports highlight contamination of the sample by glycine (2), iodine (30), caffeine (31) and other constituents of the test strip, which leads to unnecessary further investigation. To resolve this problem, urine should be transferred to the strip instead of immersing the test strip into the specimen. Dipping is only acceptable if a separate aliquot is available.
Table 2B. Influence of preservatives on test strip reactions.
A detailed table for the correct preservation of 24-hour urine specimens published by the National Committee for Clinical Laboratory Standards (NCCLS) and CLIS is based on the recommendations of the major textbooks and the largest reference clinical laboratories (e.g. Mayo Medical Laboratories). As specimen requirements can be conflicting when a number of tests are required, several different approaches have been proposed ranging from collection of multiple 24-hour specimens to the use of containers with a two-way split or three-way split of the preservative. When a 24-hour urine volume exceeds the volume of a single container, the urine of two 24-hour containers should be well mixed before analysis. It is recommended to regularly check the current requirement from reference laboratories as they may change from time to time (10,13,32,33).
Interfering effect of different urine components on test strip analyses
Due to the presence of alkaline medication or stale urine, highly buffered alkaline urine (pH 9) may result in false-positive test strip results for proteinuria. A similar phenomenon is observed (a) if the test strip is left submerged in the urine sample for a too long time period, (b) if quaternary ammonium compounds are used for cleaning the urine containers, (c) if patients are treated with polyvinylpyrrolodione or phenazopyridine, (d) if skin cleansers with chlorhexidine gluconate are used or (e) if blood, vaginal discharge, pus, semen or heavy mucus are contaminating the specimen. False-negative results are reported in diluted urine or in the presence of slightly elevated proteinuria other than albuminuria (globulin, immunoglobulin, light chains) (10,34).
At this moment, no urinary components have been associated with false-positive glucose oxidase reactions. However, contamination with strong oxidizing cleaning agents peroxide or hydrochloric acid can result in a false-positive reaction. Using automated methods for some brands of reagent strips, falsely elevated urinary glucose test strip results can also be caused by elevated urobilinogen concentrations (34). In addition, the temperature can affect the sensitivity of glucose due to its effect on the enzyme reaction. An alkaline pH, a urinary tract infection, an elevated specific gravity and high urinary ascorbate concentrations [oral or parenteral intake of large doses of ascorbic acid or vitamin C (2-15 g/day)] may decrease the sensitivity of glucose oxidase (10,35). For that reason the test should be repeated at least one day after the last intake of vitamin C. Using some reagent strips, false-negative results have been reported in the presence of moderately high ketone concentrations (40 mg/dL) (36).
False-positive reactions for ketones or ketone bodies are seen in (a) urine samples with a low pH and a high specific gravity, in (b) urine containing a high amount of levodopa metabolites, (c) in the presence of compounds with sulfhydryl groups (e.g. captopril) or in (d) highly pigmented urine samples (34). An improper storage can lead to false-negative results and beta-hydroxybutyrate is not detected (10,34).
Screening tests for occult blood can become false-positive by (a) certain oxidizing contaminants (hypochlorites when cleaning urine containers or in the presence of bacterial peroxidases by a high bacterial content) (37,38) or by (b) contamination with povidone-iodine (39), (c) menstrual blood, (d) semen or (e) myoglobinuria (34,40). As urine dipsticks are characterized by a very high sensitivity for intact erythrocytes and free hemoglobin, transient hematuria is a common finding. To rule out transient hematuria, the urinalysis should be repeated on different occasions in asymptomatic patients with a positive dipstick result for hematuria and an otherwise normal urinalysis. If persistently positive results for blood are found, clinicians should confirm the presence of erythrocytes in urine by a microscopic sediment analysis. A strongly positive dipstick in combination with a non-corresponding negative urine sediment can be explained by lysis of erythrocytes and release of free hemoglobin in patients with dilute urine of normal colour. The same finding in subjects with grossly bloody urine specimens is suggestive of intravascular hemolysis or rhabdomyolysis (40). A comment released together with observed (unchanged) dipstick test results pointing to the probable interference could be informative. In contrast, false-negative results can be found when the examination is delayed, when urine specimens are not well mixed before testing or when using formalin as preservative. A lower sensitivity is sometimes seen after the intake of a high amount of ascorbic acid, after the intake of captopril, in urine samples with a high concentration of proteins or nitrites or with a high specific gravity (10,34).
The interpretation of the bilirubin pad is unreliable after the expire date. False-positive reactions can be induced by indican and metabolites of etodolac, by the intake of phenazopyridine or large doses of chlorpromazine or phenazopyridine. A lower sensitivity is observed after the intake of large amounts of ascorbic acid, in the presence of a high nitrite concentration or after the exposure to light (10,34).
Atypical reactions with the urobilinogen pad have been reported by several interferering components: p-aminobenzocic acid, sulphonamides, p-aminosalicyclic acid, phenazopyridine and p-dimethylaminobenzaldehyde. In addition, coloured urine and prophobilinogen can result in false-positive reactions. False-negative results can be seen in improperly stored samples (exposure to light) or in the presence of formaldehyde (2 g/L) or in urine containing nitrite (34).
False-positive results for nitrite are seen after a too long standing at room temperature for several hours or when urine appears red. Urine samples with a high concentration of ascorbic acid, with a high specific gravity, with a low pH (≤ 6) or with an abnormally high urobilinogen concentration will reduce the test sensitivity (34).
The leukocyte esterase test can give false-positive reactions due to the use of strong oxidizing agents, formaldehyde (0.4 g/L) or sodium azide. In addition, coloured urine (bilirubinuria and beet ingestion) can result in a positive reaction. Contamination of urine with vaginal discharge/mucus or the intake of some drugs (nitrofurantion, clavulanic acid, meropenem and imipenem) can lead to misinterpretation. Vitamin C intake, proteinuria (> 5 g/L), glucosuria (> 20 g/L), 1% boric acid, trypsin inhibitor, oxalate or mercuric salts may decrease the sensitivity of the test (10,34,41).
The limitations of the detection of bacteria by multiple test strips are the following: coloured urine and in vitro growth can result in false-positive reactions, whereas a short bladder incubation time, Gram-positive bacteria, vitamin C or no intake of vegetables can give false-negative results (10).
The relative density/specific gravity can become falsely high in case of proteinuria (> 1 g/L) or the presence of ketoacids. Alkaline urine, glucose and urea can decrease the sensitivity of the analysis (10).
Finally, formaldehyde is known to lower the pH; hemoglobin, myoglobin (> 50 mg/L) and ethylenediaminetetraacetic acid (EDTA) have an influence on the creatinine determination and the determination of ascorbic acid can become false-positive by similar reducing agents (10).
Particle analysis
European urinalysis guidelines (10) have proposed to examine particles < 1 hour after voiding at ambient temperature or < 4 hours if refrigerated to avoid material lysis. Refrigeration causes a precipitation of phosphates and urates, which may affect analysis of these analytes. Hence, preparing a separate non-refrigerated aliquot is necessary if differentiation of urinary crystals is requested. Assessment of leukocytes gets doubtful when the analysis is performed more than 4 hours after sampling. However, without adding a preservative, leukocyte preservation can be fairly good even when samples were stored at room temperature for 72 h. These positive results in preserving leukocytes should be interpreted with caution, as only samples of adults had been selected (28). In pediatric specimens kept at room temperature, a rapid decrease in the white blood cell count was observed (42). Particle lysis accelerates with increasing pH (too long time lag between collection and analysis, Proteus sp. infections) (10,25,43,44) and lower relative density (typically seen in young children).
Falsely elevated red blood cell counts measured by flow cytometry could be the result of undissolved powder in the urine container (test tube) causing a background noise signal (28). Morphological erythrocyte analysis remains a separate component of urine particle analysis. Urinary tract and renal diseases can be associated with haematuria. However, also a general bleeding disorder or physiological reasons (e.g. strenuous physical exercise) and vaginal contamination (e.g. menstruation), could be the underlying explanation of this phenomenon. The morphology of urinary erythrocytes may reflect the origin of bleeding: dysmorphic erythrocytes (red cells characterized by an abnormal shape or size), especially acanthocytes or G1 cells (a ring-shaped body with one or more protruding blebs), point toward renal disease. Red blood cells with a normal morphology usually originate from the lower urinary tract (16). A more general use of this time-consuming test is hampered by the lack of unequivocal criteria for identification and quantitation of dysmorphic erythrocytes and the special training (phase contrast microscopy) needed for this examination (45). Morning urine specimens should be preferred as correct evaluation of erythrocyte morphology depends on osmolality and pH (46). An alternative approach to differentiate the bleeding site is based on specific protein analysis, e.g. urinary IgG:albumin and alpha-2-macroglobulin: albumin ratios (47).
Manual methods
Several methods have been developed for the detection of urinary elements. In the classical manual particle analysis, the presence of formed elements like red and white blood cells, epithelial cells (squamous and non-squamous epithelial cells), urinary casts (hyaline and cellular), spermatozoa, bacteria, yeasts, various artefacts (e.g. pollen, starch, glass hair, paper, textile), mucus, lipids and crystals (e.g. oxalate, carbonate, phosphate, urate and cystine) is checked microscopically (4,10,48,49). In spite of standardization, intra-assay coefficients of variation of routine sediment analysis can become as high as 100%, when residual volume of the sediment and centrifugation efficiency are taken into account (4,6,48,50). Hence, a sediment method can never be considered as reference of quantitative urinary particle counting (10).
Although centrifugation with removal of supernatant is necessary for sample concentration, it remains a major source of errors. Counting of native urine avoids the errors created by centrifugation; this procedure lowers the analytical sensitivity. In comparison with bacterial cultures, the analytical sensitivity for bacteria is poor at lower counts. The performance figure of bacteriuria depends on the operator’s skill, the bacterial species (bacilli or cocci), and on the interference caused by debris. Centrifugation causes a variable loss of erythrocytes and leukocytes, which does not allow a correct quantification. Relative losses due to centrifugation of red and white blood cells vary between 20 and 80% (10).
Mostly, microscopy is used for a rough estimate of the amount of figurated elements. After centrifugation, the specimen analysis can be performed using glass slides or a counting chamber. An advantage of using a counting chamber is a larger urine volume that can be examined, allowing a more precise analysis. However, differentiation appears to be easier through a thin liquid film, obtained by a glass slide. Moreover, urine sediment analysis using counting chambers is time-consuming. Simple particle differentiation without staining or phase contrast is not enough for renal elements. Much higher labor cost are associated with the advantage of a more precise result. A concentrated sample using a glass slide is proposed if manual evaluation is requested. Only when carefully working under standardized conditions, the results can be related to the original (in vivo) concentration (10).
Standardization of urine sediment examination consisting of urine volume, speed and time of centrifugation, concentration of urine or sediment volume, volume of sediment examined and result reporting are essential to ensure accuracy and precision of urine microscopic examination. Unless urine samples are investigated within 4 hours from micturition (at 4 °C) or within 30 min at 20 °C, preservatives should be added. Although 12 mL is the recommended urine volume for adult patients, a range of 5-12 mL urine is acceptable to examine the formed elements in urine. The acceptance of smaller urine specimens and the test protocol is determined by the individual laboratory. A notation on the lab report should be provided to mention each deviation of the standard. A 5-minute centrifugation time at 400 g [RCF, relative centrifugal force (g) = 1.118 x 10⁻⁵ x radius (cm) x RPM (revolutions per minute)] preferably at 4 °C is necessary for optimal sediment concentration. The use of the centrifuge brake is contraindicated because of sample resuspension with decreased numbers of urinary formed elements. The classical manual 12:1 sediment concentration step is followed by decantation of the supernatant until 1 mL urine is left, which is gently resuspended. The volume of urine sediment examined is determined by standardized molded plastic commercial slides and microscopic optical properties. Bright-field microscopy, phase-contrast microscopy or polarized light microscopy are used with low- and high-power magnification. The result reporting of a standardized microscope slide system should be supported by written operating procedures, characterized by a universal format, terminology (some components are expressed as qualitative terms and descriptions for fields of view, other components are enumerated), predefined reference intervals and magnification used for assessment. Finally, traceability of measured quantities and participation in an external quality assessment program are also important (10,51).
Automated methods
Combining sediment microscopy and selective test strip examination of urine helps to assure adequate specificity and sensitivity of urinalysis (4,45,50). Image analysis of native urine specimens was a first technological breakthrough, which allowed analysis of much larger number of particles, resulting in improved results. However, a lot of expertise was required to identify the different images and substantial staff time was still needed (45,50,52).
Implementation of flow cytometry in the routine urinalysis meant a huge progress in basic urinalysis. In a short time period, using only a small amount of native uncentrifugated urine, a huge amount of erythrocytes, leukocytes and epithelial cells can be evaluated (4). There appears to be a variable loss of these figurated elements in manual methods due to the many intermediate steps involved (centrifugation, decantation and resuspension of the specimen). Moreover, automation allows a better standardization of particle analysis (4,49). In contrast to manual methods, flow cytometric analysis of casts has an acceptable coefficient of variation of 17% (19).
Manual microscopy and flowcytometry show a good agreement, except for casts and ‘yeast-like’ cells, where flow cytometry is inferior. Comparing within run CV’s for particle analysis between manual methods, automated microscopy (Iris iQ200, Iris Diagnostics Inc, Chatsworth, Los Angeles, CA, USA) and flow cytometry (Sysmex UF-100, Sysmex Corporation, Kobe, Japan) showed that flow cytometry had the best within run CV for erythrocytes, whereas the best within run CV for white blood cells was obtained by automated microscopy (53). In comparison with manual microscopy, the reproducibility of automated urine sediment analyzers (LabUMat-UriSed, 77 Elektronika Kft., Hungary and H800-FUS10s100, Dirui Industrial Co. Ltd., China) was better (8.5-33.3% vs. 4.1-28.5% and 4.7-21.2%, respectively) (54). When counting equal ranges of particles, microscopy is generally inferior to automated methods (50,53).
Analysis of acute kidney injury proteins
Neutrophil gelatinase associated lipocalin (NGAL) is an emerging biomarker in the diagnosis of acute kidney injury. However, urinary tract infection and urinary neutrophil counts affect urinary values of this protein. Urinary leukocyte count correlates with NGAL concentrations: log(Y) (NGAL, μg/L) = 1.284 + 0.439 log(X) (urinary white blood cells, 109 cells/L); r = 0.518. In parallel, a correlation between NGAL and the bacterial count has been reported. In leukocyturia or tubular damage (e.g. intensive care patients), a mathematical correction has been suggested in cases with pyuria (> 100 × 109 cells/L) and urinary NGAL concentration > 100 μg/L (55).
Importance of the preanalytical phase in urine toxicology
As most drugs are characterized by a predominantly renal excretion, urine is the preferred specimen for inexpensive, noninvasive and quick substance abuse tests (56). The Clinical and Laboratory Standards Institute (CLSI) developed guidelines concerning specific requirements for the technical performance of urinary drug testing (57). The European Workplace Drug Testing Society (58), the Substance Abuse and Mental Health Services (59), the Swiss Working Group for Drugs of Abuse Testing Guidelines (60), the Joint Technical Committee (61) and the United Kingdom (62) proposed some criteria for urine validity testing based on several parameters: urinary creatinine concentration, specific gravity, nitrite, pH and presence of exogenous or endogenous substances. After checking of the integrity of the sample, positive screening tests are followed by confirmation methods (63).
It should be stressed that an appropriate collection, handling and testing of urine samples are necessary to avoid false-positive, false-negative and inconclusive test results (56). Several specimen tampering methods have been used to avoid detection: substitution of urine by another fluid, adulteration by addition of a foreign material, dilution of the urine sample by adding water. The following countermeasures have been proposed to prevent deceptive switching or purposeful contamination: (a) placing bluing agent (dye) in the toilet bowl; (b) requesting “photo” identification of the subject; (c) leaving coats, briefcases or purses outside of the collection area; (d) washing and drying hands before providing a sample; (e) observation of collection; and (f) taking temperature of the urine within four minutes of collection (57).
False-positive results can also be caused by operator errors, cleaning the skin with isopropyl alcohol, contamination of equipment, specimen confusion, mislabeling and misidentification of the subject, breaks in the chain of custody and errors during the measurement process (57). To decrease the incidence of preanalytical problems, several precautions should be taken into account. An identification and laboratory data system should be implemented; the condition of seals, shipping cartons, specimen containers and urine specimens should be checked for integrity; the information on the specimen requisition form and the external chain-of-custody form should be reviewed for completeness and accuracy (57).
Urine toxicology specimens should be stored at a temperature of 2-8 °C for five days, minimizing deterioration and protecting samples from tampering. Storage at ≤ -5 °C is recommended if analysis is postponed for more than five working days. Besides the analysis of medical samples, some additional requirements are prescribed for forensic specimens: (a) storage of the sample in the original container, (b) minimization of the number of freeze/thaw cycles to reduce specimen degradation, (c) use of control measures to ensure specimen integrity and (d) recordkeeping using internal and external chain-of-custody systems (57).
Finally, over-the-counter (OTC) drugs, prescribed medications and some foodstuff, which are chemically related to drugs of abuse, can also be detected by urinary drug tests (56). Amphetamine-related OTC drugs (ephedrine, pseudoephedrine and phenylpropanolamine) are known for their cross-reacting capacities with amphetamines screening immunoassays (64). False-positive opiate drug tests have been reported after poppy food ingestion (65). To reduce cross-reactivity and to increase drug specificity, many drug tests are routinely modified (56).
Preanalytical aspects of urine metabolomics
The monitoring of the impact of the preanalytical steps on urine sample quality and stability can be fulfilled by 1H NMR metabolic profiling. Standard operating procedures (SOPs) for deposition in biobanks have been proposed (66). Stability of the urine metabolic profile at various storage temperatures was studied for different preanalytical treatments (prestorage centrifugation, filtration and addition of sodium azide). According to the European Consensus Expert Group Report (67), biobanking procedures for urine should consider the following recommendations: (i) cells and particulate matter should be removed; (ii) storage of specimens at a temperature of -80 °C or lower; (iii) time limits for processing should be experimentally defined; (iv) specimens should be stored without additives, unless specified for a particular downstream analysis.
Is there an influence of centrifugation on analysis results?
To avoid the presence of components affecting the spectral quality, standard protocols (68) for NMR analysis of urine samples require a centrifugation at 14,000 Relative Centrifugal Force (RCF) (5 min, 4 °C). A high speed may cause destruction of cells and a release of cellular components, affecting the NMR profile. The most distant from non-precentrifuged samples are the samples precentrifuged at a speed in the 1,000-3,000 RCF range, while samples precentrifuged at 11,000 RCF are slightly closer to the aliquots that do not undergo any precentrifugation. If a mild precentrifugation (1,000-3,000 RCF) is applied, cellular components are spun down. The subsequent 14,000 RCF centrifugation of the supernatant is useful for elimination of suspended particles. Precentrifuged or non-precentrifuged samples show differences in metabolic profile, which are attributable to chemical shift changes. Soluble components released by cells in fresh urine may alter the physiochemical properties of the solution. Presence of cellular components affects NMR profiles even if non-fresh samples are analysed. NMR metabolic profiles of samples that have undergone a mild (RCF between 600 and 2,500) precentrifugation before freezing at -80 °C differ from non-precentrifuged samples stored for 7 days at the same temperature. This effect is less pronounced after storage in liquid nitrogen.
Which is the preferable preservation method?
The two most commonly used preservation methods have been compared: addition of sodium azide and the use of filtration (69) with or without a precentrifugation step. Spectral variations were followed after urine processing or thawing. pH-sensitive metabolites undergoing chemical shift variations show changes over time. Sample alkalinisation is consistent with shift variations for the He1 N-methylhistidine; also, changes in the chemical shifts of the resonances of xantine are observed with time. For some molecules, concentration changes are observed: whereas an increase of succinate and acetate are reported with time, glutamate/glutamine, urea and lactate concentrations decrease. Filtration stabilizes NMR spectra over time.
What are the recommendations?
The origin of changes that affect the NMR spectra can be the result of a combination of chemical reactions, bacterial growth and enzymatic activities of urine. For maintaining the original urine metabolome, the following procedures for optimal processing and management have been proposed: (i) the combined use of a mild pre-centrifugation (RCF between 1,000 and 3,000 at 4 °C) and filtration should remove cells and particulate matters; (ii) samples should be stored long-term in liquid nitrogen to avoid destruction of residual cells; (iii) fast processing; (iv) storage at 4°C between collection and processing. Addition of additives is to be avoided since the required concentrations will generate NMR signals covering the resonance of metabolites and may affect the original NMR profiles. For the maintenance of the metabolome, time between collection and processing and the temperature at which urine specimens are kept during this time delay should be reduced (68).
Optimal urine quality management in a routine clinical laboratory
To improve the optimal urine quality management in routine clinical laboratories, the CLSI develops best practices in clinical and laboratory testing by using a core set of “quality system essentials” and promotes the use of these standards worldwide (13). Besides, the International Standards Organization (ISO) document 15189:2007 lists particular requirements for quality and competence (70). Looking at the most recent CLSI recommendations, it is stated that high quality urine samples can only be delivered by appropriate urine collection tubes (made of clear plastic and with conical bases for microscopic analysis of urine sediment) and leak-proof containers. In addition, high quality pipettes and standardized microscope slides with calibrated volumes for analysis of urine sediment are essential. A second important preanalytical point is whether preservatives are used or not, as unpreserved samples can give rise to bacterial proliferation. Refrigeration for storage or transportation should always be followed by equilibration to room temperature and well mixing before analysis. Several drugs can disturb the test results of urinalysis, which implies that a ‘drug-free” specimen can only be achieved by temporary cessation of a particular medication. Besides the influence of clarity and colour of the urine samples, a number of substances can interfere with dipstick tests, according to the type of test strip. In comparison with random urine testing, the examination of chemical analytes is more reliable when timed sampling is used, which is however prone to preanalytical errors. Microbiological cultures and antibiotic susceptibility testing can be influenced by contamination, defined as the presence of more than 10,000 CFU/mL of two or more organisms. Random urine samples have a higher contamination risk in comparison with midstream clean catch samples. False-positive results can also be caused by bacterial overgrowth due to delays in the transport of samples. Treatment with antibiotics prior to urine sampling can lead to false-negative reports.
Summary
Urinalysis plays a key role as an aid in the differential diagnosis of many renal and urologic diseases. The preanalytical phase, including biological collection, identification, storage and specimen transport, preparation for analyses of the specimen (e.g. centrifugation, freezing, thawing, aliquoting and sampling) largely determines the analytical process and the over-all quality. For that reason we have presented guidelines for a correct preanalytical management of urine samples in a flowchart (Figure 1).
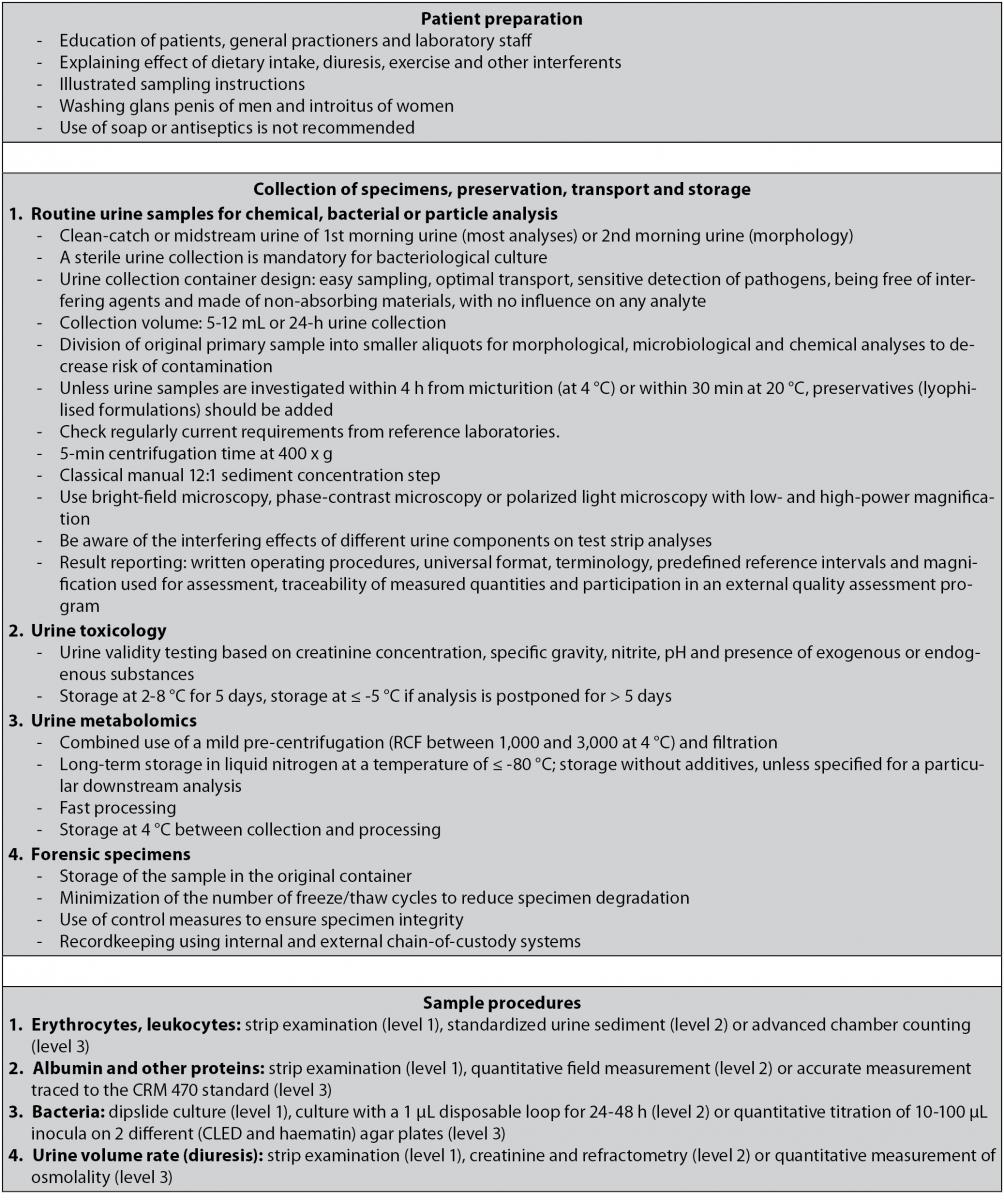
Figure 1. Flowchart illustrating the guidelines for a correct preanalytical management of urine samples.
As urine samples are often collected by patients themselves, the analysis of urine is one of the most susceptible examinations to preanalytical issues. In addition to the insurance of correct sampling, the clinical lab should optimize transport and sample preservation. Next to the use of a primary urine container, it is recommended to split the original urine sample into various smaller aliquots for morphological, microbiological and chemical analyses, decreasing the risk of contamination. Implementation of vacuum systems has enabled swift transport of urine specimens and limits the risk of contamination and errors. The disruptive force generated by the vacuum on brittle figurated elements (e.g. casts) is generally underestimated and insufficiently examined.
As modern urinalysis (flow cytometry, automated microscopy)is characterized by a low CV, preanalytical aspects of urinalysis are of growing importance. Special attention should be paid to casts, the most brittle structures in sediment analysis. There is a call for novel studies to optimize the analysis of urine sediment. The investigation of dysmorphic erythrocytes, in particular acanthocytes, is also important in the diagnosis of glomerular disorders. The analysis of urine sediment cannot yet be abandoned in the 21st century.
The time lag between voiding and examination of urine is a limiting factor for the over-all diagnostic accuracy. No preservatives are needed for many chemical analytes examined with test strips, if the sample is refrigerated and the analysis can be performed within 24 hours. If a delay cannot be avoided and refrigeration is not possible, urine containers prefilled with preservative (boric acid alone or in combination with formate or other stabilizers) may be used. Since in everyday routine, most of the clinical laboratories are receiving urine samples with delays of several hours, we recommend to use refrigeration as a preservative instead of chemical preservatives for urinalysis according to the guidelines of the NCCLS (13). If commercially available preservatives are used, their influence on chemical properties and appearance of particles should be kept in mind. Ideally, preservatives are present in a lyophilized form. An important interference of preservatives with several chemical assays has been demonstrated. Most urine preservatives were originally only intended for preventing bacterial growth and not to perform chemical analysis or particle counting. The combined use of test strip analysis and particle analysis (manual or automated) as a first step before bacteriological analysis has been proposed by guidelines in different algorithms to assure efficient use of resources (4). As there is currently no preservative that is able to stabilize urine for chemical and particle analysis, novel research projects are needed. Until the development of such a preservative, clinical labs need to prepare two aliquots. Only a preservative stabilizing both bacteria and urinary particles can be considered as a valid alternative for sample refrigeration. As urine metabolomics has become a hot topic, the European Consensus Expert Group Report has published a number of recommendations for biobanking procedures (67).