Introduction
Current state of microarray technology makes parallel expression analysis of tens of thousands human genes possible on a single slide (1). However, in comparison to routine laboratory diagnostic procedures which could produce accurate and valuable diagnostic results in a matter of minutes or hours at low cost, it represents quite an expensive, slow and inefficient diagnostic tool. For reliable diagnostic application, besides slides, reagents and microarray reader, it requires sophisticated computational assistance and at least three replicates of a single experiment. These properties make the technology unsuitable for routine diagnostic work.
Nevertheless, diagnostic application of gene expression microarray technology could be considered. One can use gene expression analysis for differentiation between closely related clinical states, i.e. as a tool for establishment of diagnosis in some extremely complex cases. In addition, a gene expression dataset obtained during a clinical experiment based on a control and test group of participants can be applied for selection of a subset of genes relevant for identification and/or differentiation of examined clinical conditions. Quantitative analysis of RNA or protein products of these genes in body fluids or tissues is a much easier, cheaper, faster and more reliable alternative to gene expression profiling. Selection of relevant genes and evaluation of clinical usefulness of the determination of corresponding RNA and protein products provide the framework for application of gene expression profiling for new biomarker screening purposes.
Gene expression results obtained during well-designed clinical experiments represent a rich source of data related to examined clinical condition. In fact, data matrices obtained in such experiments are too rich with information. They contain hundreds of thousands of numerical results that make them too complex for simple visual inspection and analysis. In such settings, the selection of a few relevant genes from a set of tens of thousands of genes represents challenging dimensionality reduction task. Therefore, computational support is needed.
Computational implementations of machine and statistical learning methods called filters could be used for such tasks. In case of monogenetic conditions/diseases, conventional statistical tools like ANOVA, t-test and their nonparametric counterparts with or without modifications could be applied (1, 2). Even in cases characterized by independent change in a few genes, these tools can be reliably used. However, in most instances analyzed clinical conditions are consequences of highly interdependent multigenetic changes. In such instances multivariate computational and/or statistical methods represent the only appropriate tool for selection of relevant genes or diagnostic assessment (3). Sometimes the complexity of relationship between a certain clinical condition and corresponding gene expressions disables dimensionality reduction (4). In some cases even the establishment of a reliable quantitative, predictive model based on acomplete set of gene expressions is impossible. This is especially the case when microarray results are used for prognostic purposes (5) or in cases when analyzed dataset of participants is small and heterogeneous. However, application of multivariate filters could in many instances produce a set of genes that represent good candidate biomarkers of a certain clinical condition.
Unfortunately, the number of multivariate filters is not very large. Besides mutual information based approaches (6,7,8), certain statistical and machine learning/prediction tools could be used for multivariate selection of relevant genes, i.e. dimensionality reduction. Computational hybrids that incorporate artificial genetic algorithms and some learning tools, like support vector machines, represent the most frequently used multivariate feature selection and diagnostic assessment tool (9).
Another multivariate filter/prediction tool known as random forests has been relatively recently introduced by Breiman (10,11,12). This method is rooted in an older method known as classification and regression trees (CART) (13). In comparison to CART, RF introduces randomization (14). Samples and genes are randomly partitioned many times. On each partition of a set of objects into a learning and test set, a single decision tree is grown based on a randomly selected subset of genes that represents the most suitable solution in terms of predictive accuracy for aclinical condition. Quality of each branching point (gene) of a tree is analyzed by rerandomization and obtained results in terms of Ginis’ measure are used for gene ranking (10,11). Besides, an ensemble composed of all decision trees could be used for diagnostic assessment based on complete gene expression profiles. Detailed description of RF methodology could be found in the list of publications.
While predictive quality of RF has been extensively validated and RF suitability for predictive purposes has been proven (10,11,12), the first application of this method in gene ranking has been only recently published (15). Therefore biomarker candidate selection based on application of RF has not been thoroughly analyzed. The aim of this study was to evaluate suitability of RF for biomarker selection from gene expression profile datasets.
Materials and methods
Three well-described gene expression profile datasets taken from literature were chosen for analysis of RF-based relevant gene selection. Namely, AML/ALL, medulloblastoma and colon cancer datasets were initially selected. These datasets have been established as benchmarks for prediction tools as well as benchmarks for relevant gene selection (5,16,17 and publications cited therein). All datasets were collected during the clinical experiments that involved two groups of participants characterized by, in a certain sense, opposite clinical conditions. Under given circumstances diagnostic/prognostic assessment represents two-class prediction problem for all datasets.
AML/ALL dataset was composed of 72 gene expression profiles consisting of 7,129 gene expressions of patients suffering from acute myeloid (25 samples) or acute lymphatic leukemia (47 samples) and it represented a problem of clinical condition classification. This set was chosen since the molecular basis of disease development and routine diagnostic differentiation between selected diseases have been captured in great detail (18). Such knowledge enables evaluation of relevant gene selection procedure. The other two datasets were selected since they represent different types of diagnostic problems and different levels of prediction complexity. Colon cancer dataset consisted of 62 gene expression profiles that contained 2,000 gene expressions per participant. Participants were either colon cancer patients (22 samples) or apparently healthy subjects (40 samples). Medulloblastoma dataset represented the most complex case where disease prognosis was sought. This set was composed of 60 samples taken from patients suffering from medulloblastoma whose survival was monitored for a certain period of time. 39 patients survived, while 21 patients died during the monitoring. The dataset contained 7,129 gene expressions per sample. For detailed description of selected datasets, see a paper published by Mukherjee et al. and publications cited therein (5).
Throughout this section, prediction complexity is stated along with other dataset properties, although dimensionality reduction rather than prediction represents the subject of the article. It should be stated that if a valid predictive model based on a complete gene expression profile could not be established, dimensionality reduction based on an invalid model would not make much sense. On the other hand, in certain cases when reasonable dimensionality reduction could not be made, valid predictive models based on a complete gene expression profile are still useful. For these reasons dataset properties related to generalization/prediction are also included in the text. R 2.2.0. statistical language (19) implementation of RF was used in this study (11). Besides the number of trees which was set to
30 000, all other user-defined variables were set to their default values throughout the study. Increased number of trees enabled better gene expression ranking without compromising generalization properties (10). All calculations were executed on a Windows™ driven personal computer. Flowchart in Figure 1 provides a sequence of steps essential for this study:
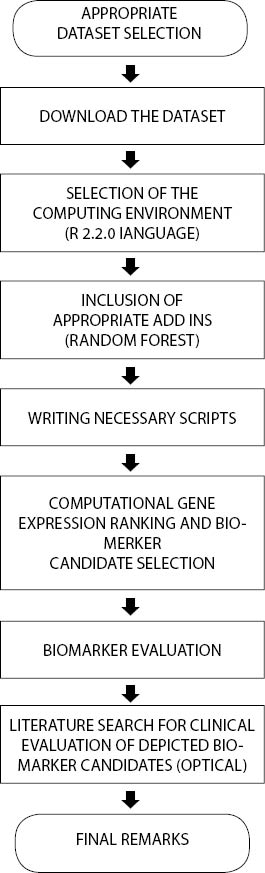
Figure 1. Study organization
At the end of this section some terminology discrepancies should be cleared out. Throughout the text hereinafter the terms “accuracy” and “diagnostic efficacy” are used interchangeably. The first term is used by computational community while biomedical community uses the second term for the same quality. In cases when the term “predictive accuracy” is used, separate, i.e. independent test set accuracy is calculated. Predictive accuracy is therefore a mathematical model validation parameter that describes predictive quality instead of descriptive quality that is quantified by accuracy obtained on the same set which was used for learning.
Results
RF analysis of chosen gene expression profile datasets was conducted according to described experimental settings. 30 highest-ranking genes obtained for AML/ALL dataset are listed in Table 1.
Table 1. 30 highest-ranking genes obtained by application of RF on AML/ALL dataset.
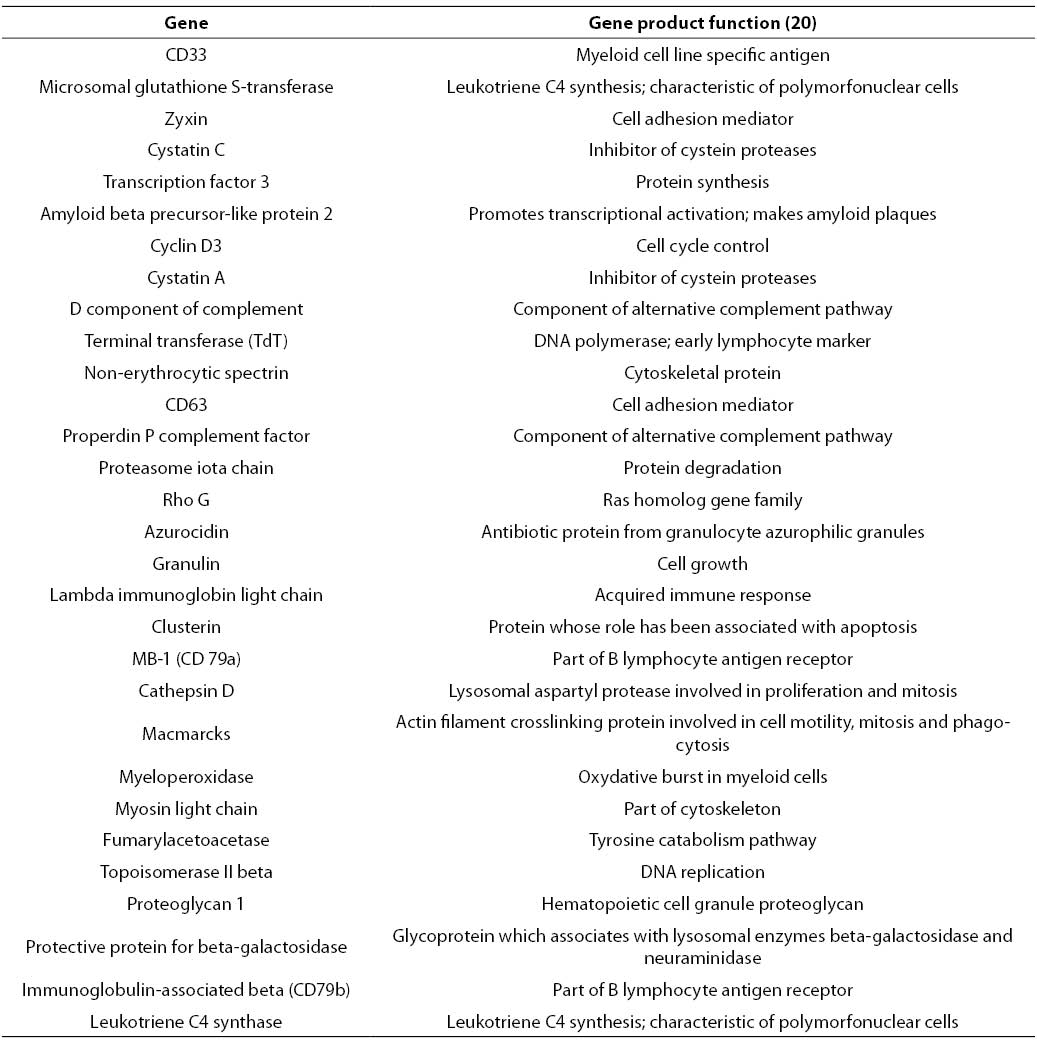
In contrast to genetic algorithm or some of mutual information based filters that provide relevant gene subsets with restricted number of elements, RF based gene selection ranks all genes contained in the starting set. However, only the highest-ranking genes represent those genes whose expression is the most relevant for the distinction between analyzed clinical conditions. In AML/ALL study, 30 highest-ranking genes were selected. This number represents less than 0.5% of the starting number of genes, which is a considerable dimensionality reduction.
Among other genes depicted in Table 1, CD33, TdT and myeloperoxidase could be found. Protein products of these genes are well-known immunochemical or cytochemical biomarkers for AML/ALL differentiation (18). Besides aforementioned cytochemical biomarkers, specific and nonspecific esterase have been routinely used for differentiation of acute myeloid and lymphatic leukemias. Unfortunately, the starting set of genes did not contain genes corresponding to these two enzymes. Among serum enzymes, lysozyme has been frequently used for AML/ALL differentiation (21). A corresponding gene was ranked by RF at the 250th position. Besides, CD33 CD10 and CD13 are sometimes used for immunochemical differentiation of AML and ALL. Corresponding genes have been ranked at the 542nd position and 392nd position, respectively. The genes that code for lysozyme, CD10 and CD13, have been placed among top 10% genes. Since there was no involvement or manipulation during the process of RF-based relevant gene selection from AML/ALL dataset, it could be stated that the selected filter captured the most important details that discriminate between AML and ALL, i.e. application of the selected filter is suitable for a given purpose under provided experimental conditions.
Besides established biomarkers, RF-based selection generated a large number of new candidates. Among others, cystatin C was selected. This biomarker for AML/ALL differentiation was recently recognized by other authors (22). The quantitative PCR method developed for determination of cystatin C provided encouraging results regarding differentiation of selected types of leukemia. These results bring further evidence of the suitability of biomarker screening based on application of RF on a given microarray dataset. However, these preliminary results of new diagnostic indication of cystatin C expression measurement need further evaluation. It would be especially important to examine the suitability of serum cystatin C concentration determination for AML/ALL discrimination.
Finally, most of the genes listed in Table 1 were found by other authors (7,8, 23), and most of them used univariate filters. This fact suggests that AML/ALL problem could be reduced to a univariate or linearly separable problem (Figures 2a and 2b).
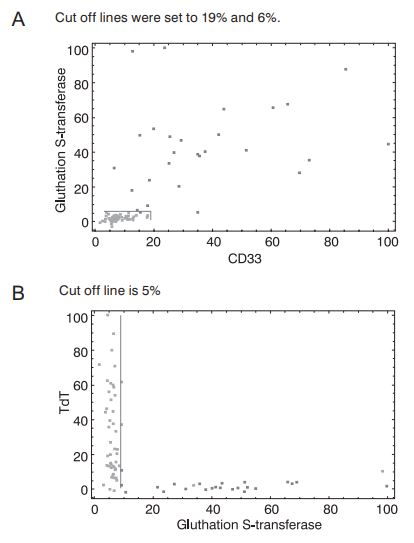
Figure 2. Separation of samples from AML/ALL dataset in the space spanned by CD33 and glutathione S-transferase (a) or glutathione S-transferase and TdT (b) expressions. AML samples are represented by dark dots, while ALL samples are represented by light dots. Gene expression coordinates are scaled. The highest measured gene expression values were set to 100%. CD33, glutathione S-transferase and TdT were taken from the highest-ranking gene list (Table 1.).
First of all, Figures 2a and 2b clearly show suitability of the selected two-dimensional differentiation between leukemias. Figure 2a presents the case where samples could be linearly separated. Even the univariate classification of AML and ALL patients could be established based on a single coordinate with reasonable accuracy (96%). Figure 2b is even more striking. Any of the coordinates (TdT, glutathione S-transferase) could be used as a univariate AML/ALL classifier with considerable certainty (accuracy for univariate, glutathione S-transferase based classification is 94%). These findings provide further evidence for correctness of the RF-based gene selection approach to AML/ALL differentiation problem. Moreover, such univariate classifiers are almost perfect candidates for routine diagnostic AML/ALL differentiation since they enable the differentiation based on a single quantitative PCR measurement. However, these figures imply that the AML/ALL dimensionality reduction problem could be easily solved by univariate filters.
It should be stated at this point that many authors obtained almost perfect results during the validation of predictive models for AML/ALL classification based on a complete gene expression profile. In all relevant cases, predictive accuracy was 90% or higher. This fact suggests that suitability of any filter including RF-based multivariate filter should be evaluated on more demanding classification problems. Colon cancer (Figure 3) and medulloblastoma (Figure 4) datasets represent such problems (5).
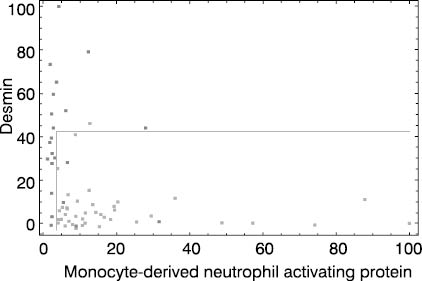
Figure 3. Colon cancer dataset. Dark dots represent colon cancer patients and light dots stand for apparently healthy individuals. Both coordinate axes (monocyte-derived neutrophyl activating protein and desmin gene expressions) are scaled to 0 - 100% interval. Cut off lines were set to 3 and 45%, respectively.
It is obvious at first glance that high quality separation of analyzed classes in the spaces spanned by two highest-ranking genes is not easy to establish, especially in medulloblastoma prognosis case. This is in agreement with results published by Mukherjee et al. (5).
Figure 3 presents typical multivariate solution for a given diagnostic problem. By careful selection of cut off values on both coordinates colon cancer patients could be differentiated from apparently healthy individuals with acceptable accuracy (92%). This result implies that expressions of at least two highest-ranking genes is needed for routine diagnostic utility. In order to improve diagnostic efficacy, application of three or more highly ranked gene expressions could be evaluated. However, by raising the number of gene expression measurements necessary for diagnostic assessment, this approach becomes inappropriate for routine diagnostic application.
Finally, Figure 4 shows that useful dimensionality reduction cannot be made in all cases. Medulloblastoma survivors and non-survivors are almost indistinguishable based on selected two-dimensional coordinate system (Figure 4).
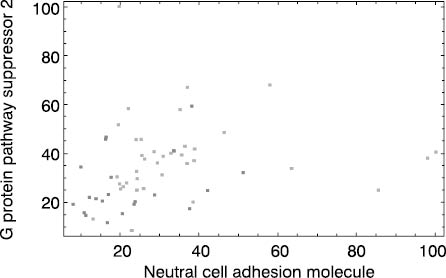
Figure 4. Medulloblastoma dataset. Dark dots represent patients who died during monitoring period and light dots stand for survivors. Both coordinate axes (neural adhesion molecule and G protein pathway suppressor 2 gene expressions) are scaled to 0 - 100% interval.
This implies that inclusion of three or more gene expressions and/or establishment of nonlinear relationship between gene expressions and survival is a necessary prerequisite for accurate prognostic assessment. This problem shows that RF-based gene expression ranking for a biomarker of medulloblastoma survival selection is not an appropriate step. Under given experimental conditions, which include a small group of heterogeneous patients/treatments, the only approach is application of microarray technology equipped with an adequate prediction tool like RF. This fact represents the advantage of tools like RF that could be used as a multivariate filter and, at the same time, they are prediction tools that could be used for prognostic/diagnostic assessment based on a complete gene expression profile. These tools are characterized by one more important property: model validation. By increasing the complexity of relationship between gene expression profile and biological variable under examination,the utility of selected biomarkers declines. Therefore adequate model validation, which provides indirect measure of analyzed relationship complexity, gives insight in usefulness of dimensionality reduction. According to this fact, acceptable validation results obtained by RF or a similar tool based on a complete gene expression profile provide the basis for further dimensionality reduction and biomarker screening. In most cases, this is an achievable task. Still, if useful dimensionality reduction is not possible, validated RF model based on complete gene profile remains as an alternative.
Conclusions
Before any attempt to select biomarker candidates from a complete gene profile is made, the suitability of a predictor, in this case RF-derived model, and/or degree of relationship complexity between gene expression profile and diagnosis/prognosis should be established. If a reliable model can be obtained based on a complete gene set, the selection of biomarker candidates can be initiated. In case of low complexity problems, RF proved to be a useful filter. Based on this approach, well-established univariate classifiers of two leukemia types were identified. Moreover, many new promising alternatives were revealed. In a bit more complex case of colon carcinoma, identification was possible of a two-dimensional classifier based on top two gene expressions obtained by RF. The proposed classifier, along with proposed corresponding cut off values, showed promising classification capabilities. Finally, application of RF on the most complex case of establishing medulloblastoma prognosis did not yield useful biomarker candidates. Due to the highly complex relationship between gene expression profiles and the prognosis (5) and the small and heterogeneous set, reasonable dimensionality reduction by application of RF was not possible.
Complete gene ranking lists from this study for all examined datasets are available on request. It has been shown that some of the new biomarkers, like cystatin C gene expression applied for AML/ALL classification, have already entered diagnostic evaluation. However, enzyme immunoassay, immunonephelometry and immunoturbidimetry and flow citometry are, unlikequantitative PCR, already present in most of the routine clinical laboratories. It would be interesting to evaluate whether some of relevant gene protein products could be useful as biomarkers of examined clinical conditions.
Acknowledgements
Author would like to thanks Ana-Maria Šimundić for critical reading of manuscript and usefull suggestions.