Introduction
The diagnostic test is one of the cornerstones of medical education and clinical practice. With roots in ancient Greece and more recent historical prominence in the work of William Osler, medical and surgical practitioners have long realized that they must become skilled at choosing appropriate methods for determining the patient’s disease or condition. Diagnostic tests range from the signs and symptoms obtained from the history and physical examination to the sophisticated laboratory and imaging tests widely used in medical practice today. Often physicians initially choose not to use the so-called “gold standard” to assist in making a diagnosis, preferring a less costly, less invasive, and/or less painful approach. For example, an exercise electrocardiogram (EKG) might first be used as a diagnostic test with a 60-year old patient with chest pain rather than the more definitive (as well as less safe and more costly) coronary angiogram. Objectives of diagnostic investigations include detecting or excluding disease; contributing to management; assessing prognosis; monitoring clinical course; and measuring general health or fitness (1).
In this issue of Biochemia Medica we present several test characteristics which clinicians rely on when selecting and interpreting diagnostic tests – highlighting several traditional approaches as well as reviewing a few test characteristics which have been described as more “evidence-based” (2). In our next article we will outline how to critically appraise a medical article reporting on a diagnostic test (3-7). We will describe the importance of study methodology, review recently detailed reporting standards and illustrate how diagnostic results are incorporated into clinical decision-making.
Diagnostic case
Mr. Brown, a 74-year-old male, comes to the Emergency Department with the complaint of acute dyspnea. He reports no chest pain and no syncope. His EKG identifies atrial fibrillation. His past medical history is significant only for hypertension. He reports no renal disease. Clinically, we feel his presentation warrants consideration of systolic cardiac dysfunction with congestive heart failure (CHF). Our focused clinical question in this situation becomes: In patients with atrial fibrillation and acute dyspnea, what is the accuracy of B-type natriuretic peptide (BNP) for diagnosing congestive heart failure?
Selecting a diagnostic test: test characteristics
Sensitivity and specificity
Before the Bayesian approach to diagnostic testing was encouraged by Evidence Based Medicine (EBM), clinicians relied exclusively on the traditional test characteristics/test performance 2 x 2 model (Figure 1).
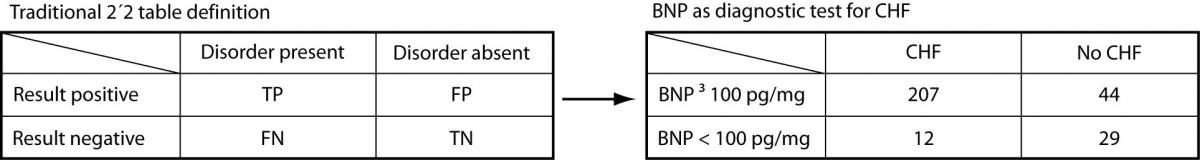
Figure 1. BNP as a diagnostic test for congestive heart failure: traditional 2 x2 model
To aid in making a diagnosis, the physician would choose a test with adequate test characteristics – i.e., sensitivityand specificity. Sensitivity is the ability of a diagnostic test to classify those with the disease as positive (above or below a specified cutoff – e.g., high fasting glucose (above the cutoff) in diagnosing diabetes mellitus but low ferritin (below the cutoff) in diagnosing iron deficiency anemia). Sensitivity describes the probability that a person with the target disorder will test positive; specificity is the ability of a diagnostic test to classify those without the disease as negative (i.e., below/above the cutoff, depending on the test). Specificity describes the probability that an individual without the target disorder will test negative.
When a BNP ≥ 100 pg/mL is used as the cutoff to classify patients as positive, Knudsen et al. (8) found that BNP had a sensitivity of 95% (95% confidence interval = 91% to 97%) and a specificity of 40% (95% CI = 28% to 52%) for diagnosing congestive heart failure (CHF) in patients with atrial fibrillation (AF) and dyspnea.
Referring to Figure 1, sensitivity is calculated as the true positives (TP) divided by the total number of patients with the disorder (true positives plus false negatives [FN]). Thus: 207 / 219 = 0.945 or 95%. In other words, nineteen of 20 patients (95%) with CHF presenting to the Emergency Department with AF and dyspnea were positive when a BNP ≥ 100 pg/mL is used as the cutoff value. Specificity is derived from dividing the true negatives (TN) by the total number of patients without the disorder (false positives [FP] plus true negatives). Thus: 29 / 73 = 0.397 or 40%. The study participants with both AF and dyspnea without congestive heart failure were negative (BNP < 100 pg/mL) only 40% of the time.
Interpreting test results: Test performance
Predictive values
In choosing a test to help make a diagnosis, the clinician is typically guided by the characteristics of the available tests, namely, their sensitivities and specificities. However, after the test is administered, the physician is interested in test performance. For this objective we can use the test’s predictive values. Positive predictive value (PPV) tells the clinician what percent of those with a positive finding has the disease. Negative predictive value (NPV) reveals what percent of those with a negative result do not have the disease. Turning to our BNP and congestive heart failure example (8), PPV is the TPs divided by the TPs and FPs (i.e., 207 / 251 = 0.824 or 82%) while NPV is the TNs divided by TNs and FNs (i.e., 29 / 41 = 0.707 or 71%). A positive predictive value of 82% tells us that a patient coming to the Emergency Department with dyspnea and who has AF in this study had congestive heart failure as the cause for his/her symptoms in 4 of 5 cases when their BNP is equal to or greater than 100 pg/mL. A negative predictive value of 71% tells us that 7 of 10 of such AF and dyspnea patients who are negative on the diagnostic test (i.e., BNP < 100 pg/mL) turned out to not have CHF.
Likelihood ratios
One of the core questions we consider when interpreting diagnostic test results is “Do test results in affected patients differ from those in normal individuals?”(9) In the process of diagnosis, clinicians use diagnostic tests to modify their initial clinical suspicion of disease to make a particular diagnosis more or less likely. The sensitivity or specificity of a particular test may be known, but how does one integrate that information with their clinical intuition, or pretest probability, to determine likelihood of a disease being present, or post-test probability? The mathematical tool to aid in this integration is the likelihood ratio. Simply stated likelihood ratios express the magnitude by which the probability of disease in a specific patient is modified by the result of a test (10). Likelihood ratios compare two probabilities: the probability that a person with a particular disease will have a specified test result versus the probability that a person without that disease will have the same test result.
The positive likelihood ratio is calculated as follows:
LR for a positive test = sensitivity/(1-specificity).
The negative likelihood ratio as follows:
LR for a negative test result = (1-sensitivity)/specificity.
The LR value can range from zero to infinity. Values less than 1 correspond to a decrease in the post-test probability of disease while values greater than 1 indicate an increase in the post-test probability of disease. A LR value of 1 indicates the test has the same likelihood of being positive or negative in those with disease as in those without disease and is not helpful.
To use LRs the initial clinical suspicion or pre-test probability of disease must first be converted to pretest odds with the following formula: odds = probability/(1 - probability). The pre-test odds are multiplied by the LR and the product yielded is the post-test odds. To convert the post-test odds back to probability (the format most clinicians are familiar with) use the following formula: probability = odds/(1+odds).
In our case, the prevalence of CHF in their study was 75% (219 out of 292 total patients) (8). As previously shown, BNP with 100pg/ml as a cut off has a sensitivity of 95% and a specificity of 40%. The positive LR would then be 0.95 /(1 - 0.4) = 1.58. And, the negative LR = (1 - 0.95)/0.4 = 0.125. Using 75% as our pre-test probability, we then convert this prevalence to odds as follows: 0.75/(1-0.75) = 3:1. If the BNP = 300 (“positive” since ≥ 100), we use our pre-test odds and LR (+) to calculate our post-test odds as 3:1 x 1.58 = 4.74:1 and convert this to post-test probability as 4.74/(1 + 4.74) = 83%. In this case, the LR(+) of 1.58 increased our pre-test probability from 75% to only 83%, perhaps not a notable increase. Following the same procedure for a negative BNP, the post-test probability is determined to be 27% (try the math and double-check our work!). The drop from 75% to 27% was certainly of greater magnitude than for the LR(+). Figure 2 can be used to guide clinicians on how to interpret different values for LR’s from clinical studies.
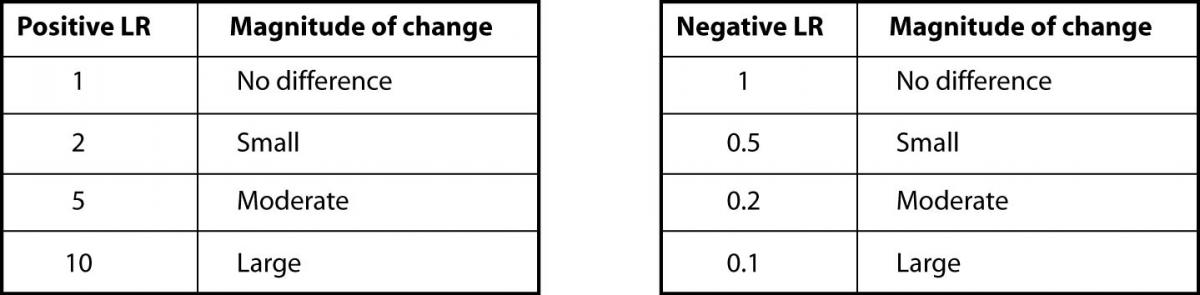
Figure 2. Likelihood ratios and expected pre-test to post-test probability difference
Alternatively, a nomogram can be used to eliminate the need for calculations or estimations (Figure 3). It is used by drawing a line from the pre-test probability through the LR (positive, then negative) to identify the post-test probability.
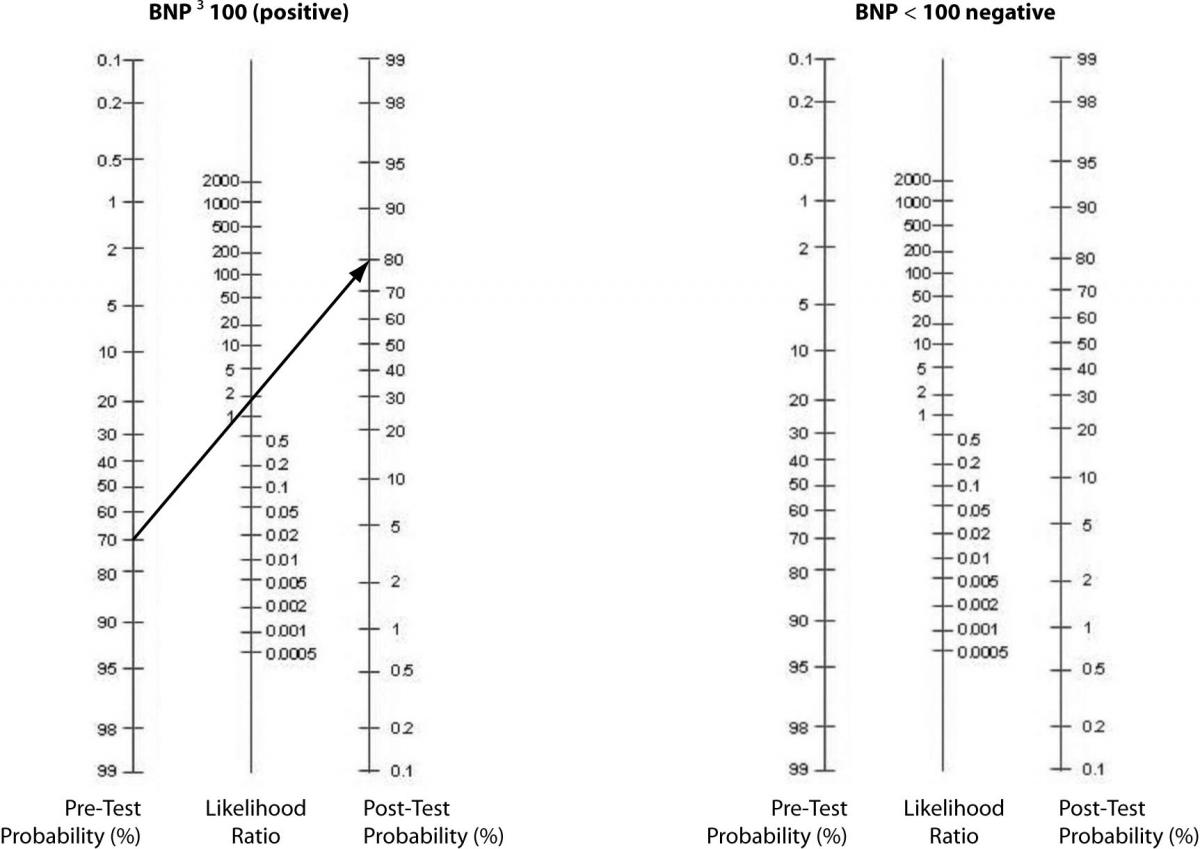
Figure 3. Fagan’s Nomogram – Pre-test to Post-test probabilities.
Integrating indicators of test characteristics and performance
In an era of evidence-based practice, physicians need high quality data to support decisions about whether or not to use a diagnostic test in a specific clinical situation, which test to choose, and how to use the results to aid in decision-making. As emphasized earlier, test characteristics [sensitivity and specificity; LR (+) and LR (-)] are used for selecting a diagnostic test while measures of test performance (positive and negative predictive values; post-test probability) are utilized in interpreting a patient’s test result. However, since there are no simple aggregation rules for combining indicators of test characteristics and performance, clinicians, researchers, and educators have sought helpful approaches to integrating diagnostic test indices to aid in making judgments in patient care. We will now review some of the approaches to integrating the individual indices that emerge from diagnostic testing.
ROC Curves
Receiver Operator Characteristic (ROC) curves can describe the changes in sensitivity and specificity for a single test with numerous cutoff points (like the BNP measurement in our example) as well as compare the performance of different tests used to diagnose the same disease. ROC curves are plots of the true positive rate (i.e., sensitivity) on the vertical or y axis versus the false positive rate (1-specificity) on the horizontal or x axis for the multiple cutoff points of a diagnostic test. Figure 4 illustrates an ROC curve. We can use ROC curves to choose the optimal cutoff that minimizes the percent of false positive and false negative results. Note that on the ROC curve the optimal point is located at the curve location closest to the upper-left hand corner of the plot.
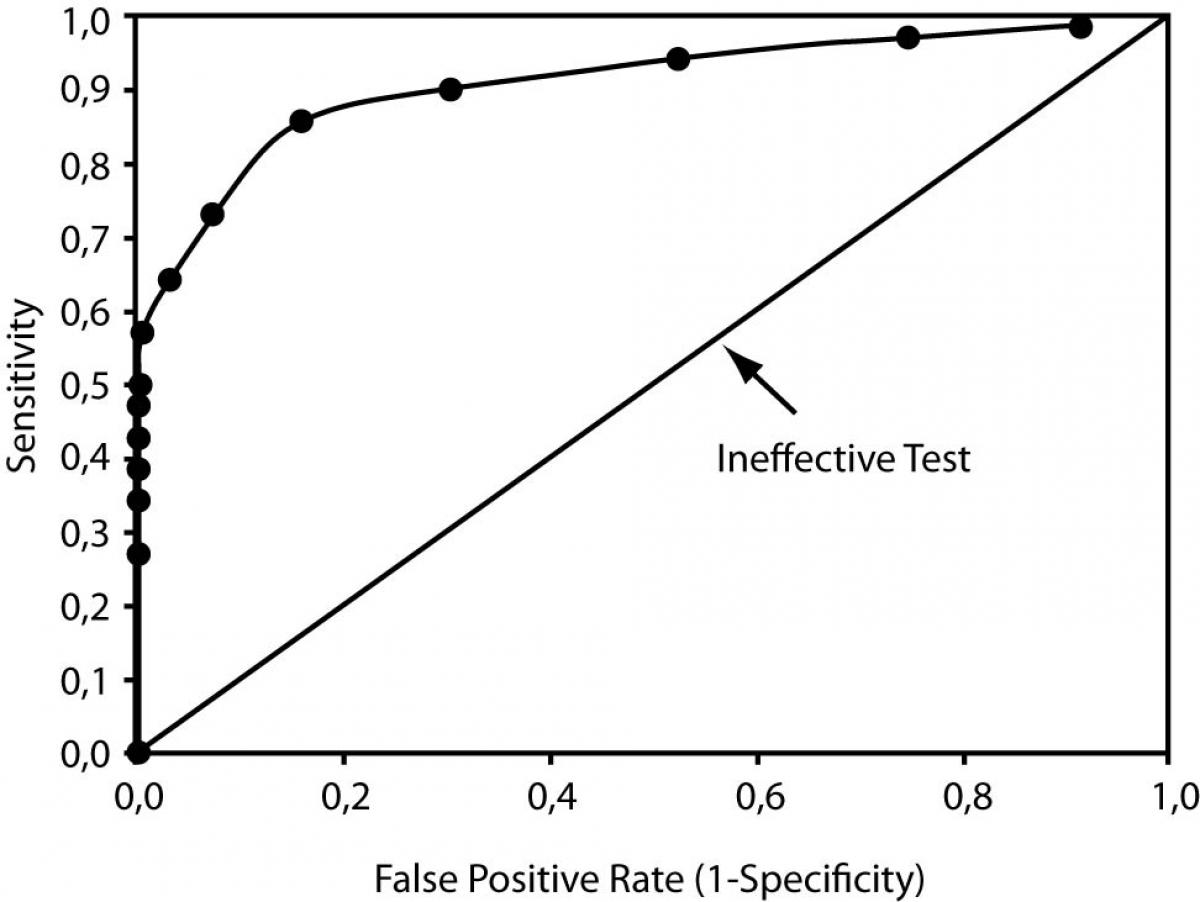
Figure 4. Receiver Operator Characteristic Curve
Further, overall test performance, or accuracy (to use the technical term), can be determined by measuring the area under the ROC curve (a value reported with all the familiar statistical software packages). Poor to useless tests have ROC under the curve areas close to 0.50, and the plot appears as a diagonal where the true positive rate equals the false positive rate (see the diagonal line in Figure 4). For an excellent test, the ROC curve rises steeply and passes close to the upper left-hand corner; the perfect test has an area under the curve of 1.0, and both the sensitivity and specificity are 100%.
Depending upon the outcome and patient population, ROC curves can be used for diagnostic, monitoring, and prognostic applications in laboratory medicine. For example, to compare test performance of two test procedures or strategies, the areas under the curves can be examined for a difference; the test or strategy with the significantly greater area under the ROC curve has the better performance.
Diagnostic accuracy
Accuracy is the probability that an individual will be correctly classified by a test; that is, the sum of the true positives plus true negatives divided by the total number of individuals tested. For our BNP case, our calculation would be: (207 + 29) / 292 = 0.81. In other words, 81% of the patients in this study were classified appropriately in their diseased or non-diseased groups with the BNP cutoff value of 100 pg/mL.
Accuracy represents the weighted average of sensitivity and specificity, where sensitivity is weighted by the prevalence of the outcome in the study population and specificity is weighted by the complement of the prevalence. Unfortunately, only in rare instances will accuracy closely approximate both sensitivity and specificity, such as when sensitivity and specificity are equal or nearly equal to each other, or, when disease prevalence is close to 50%. Despite the intuitive appeal of accuracy as a single measure of test validity, its dependence on prevalence renders it inferior to the careful and balanced consideration of individual measures of test characteristics and performance.
Effects of disease prevalence
Likelihood ratios, area under ROC curves, and diagnostic accuracy incorporate both test characteristics – i.e., sensitivity and specificity. The positive and negative likelihood ratios and the area under ROC curve are calculated exclusively with sensitivity and specificity. Thus, these indices do not vary with disease prevalence. In contrast, accuracy does vary with disease prevalence (11). This effect of disease prevalence is also present when interpreting a test’s predictive values - as the prevalence falls, so too does the positive predictive value, while the negative predictive value rises.
Diagnostic odds ratio
As a measure of test performance the diagnostic odds ratio (DOR) combines the strengths of sensitivity and specificity, as prevalence independent indicators, with the advantage of accuracy as a single indicator. The odds ratio is a familiar statistic in epidemiology expressing the strength of association between exposure and disease. As such, it also can be applied to express the strength of association between test result and disease.
The diagnostic odds ratio of a test is the ratio of the odds of positivity in disease relative to the odds of positivity in the nondiseased. The value of a DOR ranges from 0 to infinity, with higher values indicating better discriminatory test performance.
DOR = (TP/FN)/(FP/TN) = (sensitivity/(1- sensitivity))/((1-specificity)/ specificity)
and
DOR = (TP/FP)/(FN/TN) = (PPV/(1-PPV))/((1-NPV)/NPV) = LR+/LR-
For our article the calculation would be: DOR = (0.95/0.05)/ (0.6/0.4) = 12.67.
Since it expresses diagnostic performance as a single term, the diagnostic odds ratio is particularly useful when comparing the performance of competing tests. Comparing competing tests using paired indicators, such as sensitivity and specificity, can be complicated especially if one test does not outperform the other on both indicators (13). For this reason, reporting the diagnostic odds ratio should be considered a preferred method for reporting test performance.
Conclusions
In practice, the clinician develops a list of possible diagnoses or causes for the observed illness and assigns a probability to each. These pre-test probabilities are equivalent to the prevalence of the disease in patients having the same characteristics, signs, symptoms, history, and overall clinical picture. After estimating the pre-test probability we request testing from services such as radiology, pathology, and/or laboratory medicine. As we have demonstrated, the clinician can estimate the post-test probability using the pre-test probability and background knowledge of the test’s performance characteristics. We must then decide the diagnosis, estimate likelihood of potential outcomes, and determine the disposition and treatment options in the context of the individual patient’s medical history, other tests, and personal preferences. If the test has no potential for impacting decisions regarding diagnosis, prognosis, disposition, or treatment, then the test should not have been requested in the first place.
We have reviewed the basic features of a test that are important factors in considering selection and interpretation of diagnostic tests with this clinical process in mind.
Each index has its own advantages and disadvantages in clinical application. For example, global measures of test accuracy assess only the ability of the test to discriminate between people with and without a disease. These include the area under the ROC curve and the diagnostic odds ratio. Such results may suffice for health policy decisions – for example, to decide whether a new test is generally better than an existing test for the target condition. However, neither of these measures of a test’s discriminatory power is especially useful for determining the probability of disease in individual patients. On the other hand, the predictive value, sensitivity, specificity, and likelihood ratios either directly estimate probability of disease in individuals or can be used to estimate probability of disease in individuals using Bayes’theorem (14).
As a whole, diagnostic tests are mostly valuable as complementary information to clinical assessment, particularly when the pre-test probability of a disease is intermediate. Clinicians often forget this basic tenet and order tests to ‘diagnose’ or ‘to rule out’ conditions rather than to corroborate or challenge a clinical hypothesis.
Advances in diagnostic modalities may enhance patient care only if guided by careful clinical judgment. Before ordering a diagnostic test, one must consider more than the value of the test for accepting or rejecting a diagnosis; the clinician must evaluate the potential benefit and risks of the test and how the results will alter patient management (10). Becoming familiar with the various test measurement options that are available to us and how to interpret these results is the first step toward making evidence-based diagnostic decisions. In the next article we will build on these skills, demonstrating how to link this information to the care of an individual patient. Important diagnostic research methodology and reporting standards will also be reviewed.
Case Summary
For our patient that presented with acute dypnea and atrial fibrillation we considered the diagnosis of congestive heart failure. Following the evidence-based medicine approach to clinical decision making, we referred to published diagnostic research to assess the accuracy of B-type natriuretic peptide (BNP) in CHF – the results are summarized in figure 5.
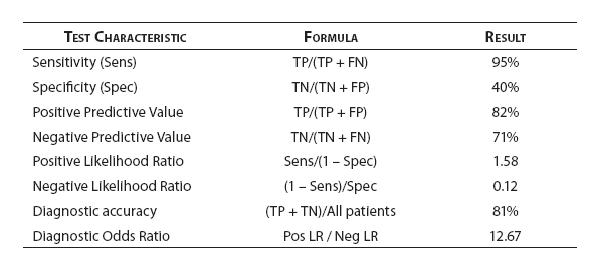
Figure 5. BNP diagnostic performance - test characteristic summary