Introduction
There are a number of statistics that are helpful for making decisions about clinical interventions or drawing conclusions about effects of various substances or events in health-related situations, and one seen frequently is called the odds ratio. The OR evaluates whether the odds of a certain event or outcome is the same for two groups. Specifically, the OR measures the ratio of the odds that an event or result will occur to the odds of the event not happening. Clinically, that often means that the researcher measures the ratio of the odds of a disease occurring or a death from a specific injury or illness happening to the odds of the disease or death not occurring.
The odds ratio is used when one of two possible events or outcomes are measured, and there is a supposed causative factor. The odds ratio is a versatile and robust statistic. For example, it can calculate the odds of an event happening given a particular treatment intervention (1). It can calculate the odds of a health outcome given exposure versus non-exposure to a substance or event (2). The clinical literature exhibits many instances of the odds ratio being used in research to estimate reduction in disease or disease complications if patients receive a particular drug or vaccine (3,4,5). The odds ratio is a measure of effect size (as is the Pearson Correlation Coefficient) and therefore provides information on the strength of relationship between two variables. It is an indirect measure however, as will be seen in the section on interpretation of the statistic.
Calculation of the Odds Ratio
The calculation of the odds ratio is quite simple. The formula is as follows:
Where “PG1” represents the odds of the event of interest for Group 1, and “PG2” represents the odds of the event of interest for Group 2.
Another way to represent the formula is in table format:
Standard New
Treatment Treatment
Event Happens a b
Event does c d
not happen
OR = (a/b)/(c/d) or: OR = (a × d)/(b × c)
Given the algebraic rule of cross products, the second formula will produce the same result as the other two formulae for odds ratio and is the more commonly reported formula.
Significance Tests for the Odds Ratio
The first thing to understand when considering a significance test for the OR is that the true neutral value (indicating equal odds for both conditions) is one (1), not 0 (zero). Several significance tests can be used for the Odds Ratio. The most common are the Fisher’s Exact Probability test, the Pearson Chi-Square and the Likelihood Ratio Chi-Square.
Fisher’s Exact
Often, the OR dataset takes the form of a 2 x 2 table, and for that situation, a Fisher’s Exact Ratio test should be used. The formula for the Fisher’s Exact is:
Where “p” is the Fisher’s Exact Probability, “a, b, c, d” represent the counts in the cells, and “n” represents the total sum of the values in all four cells.
Chi-Square
When there are more than 4 cells (or at the researcher’s convenience), the Chi-Square test should be used. Chi-Square (c2) assumes that the numbers in the cells represent counts and not proportions or averages, and it assumes that the value of the expecteds is 5 or greater in 80% or more of the cells. The value of the probability must be evaluated through a table of Fisher’s Exact Probability values for one degree of freedom to obtain the significance value for the test. Most statistical computer programs such as Stata and SPSS will calculate the Fisher’s Exact and Chi-Square values and provide the significance value of the result. The Chi-Square formula is:
Where “o” represents observed frequencies and “e” represents expected frequencies.
Likelihood Ratio Chi-Square
The Likelihood Ratio Chi-Square, like all likelihood ratio statistics is a logarithmic formula. If the data are entered into a statistical analysis program, this is the most appropriate test of significance for the Odds Ratio. Its formula is as follows:
Where “G” represents the Likelihood Ratio statistic, ¦ represents observed values, ¦i represents expected values, and “ln” indicates the log to be taken.
Standard Error and Confidence Intervals for the Odds Ratio
The odds ratio is skewed, so it is not possible to directly calculate the standard error of the statistic. However, the standard error for the natural logarithm of the odds ratio is quite simple to calculate. It is calculated as follows:
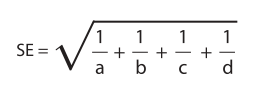
Then all one needsto do to construct confidence intervals about the natural logarithm is to calculate the standard error using the above formula and add that value (or a multiple of that value) to the log of the odds ratio value for the upper CI (confidence interval) and subtract that value (or a multiple of that value) to the log of the odds ratio value for the lower CI. More advanced information on direct computation of the confidence intervals for odds ratios can be obtained from the paper published by Sorana Bolboaca and Andrei Achimas Cadariu (7) and from the paper published by Simundic (8).
It should be remembered that the concept of “no difference” in most statistics refers to a difference of zero, and is generally measured with the variable means. The OR is different. The “no difference” value for this statistic is 1 and therefore, when a confidence interval includes the value of 1, the researcher or clinician will know that the odds of the measured outcome are the same for both (or all) treatment groups, even without a significance test.
Examples of Uses of the Odds Ratio
Determination of results of a drug study
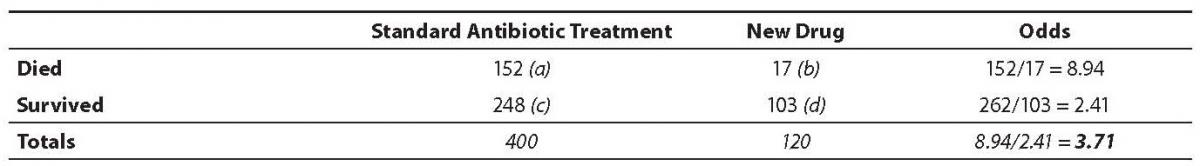
One common use of the OR is in determination of the effect size of a difference in two drug interventions. As an example, consider the treatment of patients with endocarditis caused by Staphylococcus aureus (SA). Although the mortality rate for this disease ranges from 25% to 47% (6), let us assume that in the population of interest, White males aged 30 to 60 the mortality rate is 38% with the standard antibiotic treatment of penicillin, methycillin, vancomycin and other antibiotics. However, a new drug has been developed that attacks the bacteria’s ability to protect itself from the human immune system rather than interfering with cell wall development. The question is this: What are the odds of dying with the new drug as opposed to the standard antibiotic therapy protocol? The odds ratio is a way of comparing whether the odds of a certain outcome is the same for two different groups (9).
The odds ratio is simply the ratio between the following two ratios: The ratio between standard treatment and the new drug for those who died, and the ratio between standard treatment and the new drug for those who survived. From the data in the table 1, it is calculated as follows:
OR = (a/b)/(c/d) = (152/17)/
(262/103) = 8.94/2.41 = 3.71
(262/103) = 8.94/2.41 = 3.71
The formula can also be presented as (a × d)/(b × c) (this is called the cross-product). The result is the same:
OR = (152 × 103)/
(17 × 248) = (15656/4216) = 3.71.
(17 × 248) = (15656/4216) = 3.71.
The result of an odds ratio is interpreted as follows: The patients who received standard care died 3.71 times more often than patients treated with the new drug. Based on these results the researcher would recommend that all males aged 30 to 60 diagnosed with bacterial endocarditis caused by SA be prescribed the new drug. This recommendation assumes, of course, that the experience of side effects with the two categories of drugs is similar. Severe side effects or development of allergic reactions to the new drug could change that recommendation.
Table 1. Results from fictional SA endocarditis treatment study
How other odds ratio results are interpreted: An OR of 1.00 means that the two groups were equally likely to die. An OR higher than 1 means that the first group (in this case, standard care group) was more likely to experience the event (death) than the second group. An OR of less than 1 means that the first group was less likely to experience the event. However, an OR value below 1.00 is not directly interpretable. The degree to which the first group is less likely to experience the event is not the OR result. It is important to put the group expected to have higher odds of the event in the first column. It is not valid to try to determine how much less the first group’s odds of the event was than the second group’s. When the odds of the first group experiencing the event is less than the odds of the second group, one must reverse the two columns so that the second group becomes the first and the first group becomes the second. Then it will be possible to interpret the difference because that reversal will calculate how many more times the second group experienced the event than the first. If we reverse the columns in the example above, the odds ratio is: (5/22)/(45/28) = (0.2273/1.607) = 0.14 and as can be seen, that does not tell us that the new drug group died 0.14 times less than the standard treatment group. In fact, this arrangement produces a result that can only be interpreted as “the odds of the first group experiencing the event is less than the odds of the second group experiencing the event”. The degree to which the first group’s odds are lower than that of the second group is not known.
Odds ratio in epidemiology studies
In epidemiology studies, the researchers often use the odds ratio to determine post hoc if different groups had different outcomes on a particular measure. For example, Friese et al. (10) conducted a study to find out if there were different probabilities for having a larger number of surgeries for breast cancer for women whose initial diagnostic procedures included a needle biopsy versus for women who did not have an initial breast biopsy. Through use of the odds ratio, they discovered that use of the needle biopsy was associated with a reduced probability of multiple surgeries. The odds ratio table for this study would have the following structure (Table 2):
Table 2. Table format for epidemiology study
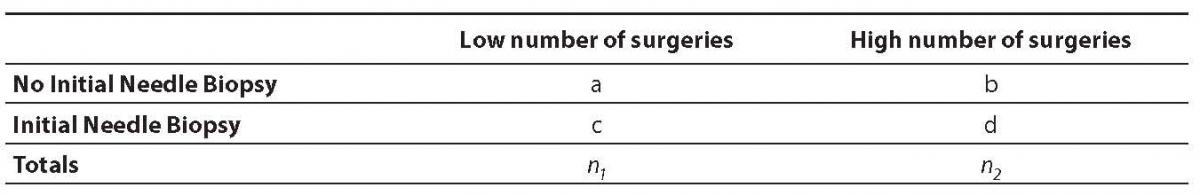
In this study, Friese et al. obtained an OR of 0.35 and concluded that use of the needle biopsy as an initial diagnostic test reduced the probability of multiple surgeries by 0.35% for women with breast cancer. (Note: This table should have been changed because an OR value of 0.35 cannot be directly interpreted. All that can be said is that the women who had an initial needle biopsy had fewer surgeries than women who did not have the biopsy.)
Conclusions
The great value of the odds ratio is that it is simple to calculate, very easy to interpret, and provides results upon which clinical decisions can be made. Furthermore, it is sometimes helpful in clinical situations to be able to provide the patient with information on the odds of one outcome versus another. Patients may decide to accept or forego painful or expensive treatments if they understand what their odds are for obtaining a desired result from the treatment. Many patients want to be involved in decisions about their treatment, but to be able to participate effectively, they must have information about their likely results in terms they can understand. At least in the industrialized world, most patients have received enough schooling to understand basic percentages and the meaning of probabilities. The odds ratio provides information that both clinicians and their patients can use for decision-making.
Odds ratios are one of a category of statistics clinicians often use to make treatment decisions. Other statistics commonly used to make treatment decisions include risk assessment statistics such as absolute risk reduction and relative risk reduction statistics. The odds ratio supports clinical decisions by providing information on the odds of a particular outcome relative to the odds of another outcome. In the endocarditis example, the risk (or odds) of dying if treated with the new drug is relative to the risk (odds) of dying if treated with the standard treatment antibiotic protocol. Relative risk assessment statistics are particularly suited to diagnostic and treatment decision-making and will be addressed in a future paper.