Risk reduction statistics
Risk reduction statistics have become increasingly important to physicians and nurses in primary care practice. As a result, papers presenting information on best treatment practices are increasingly presenting the rationale for treatment decisions in the context of risk reduction for individual patients and patient populations. This trend can be attributed to two factors. First, it is well known that no treatment can be expected to produce the desired outcome for every patient. Second, risk reduction statistics allow the practitioner to understand the probability of treatment success for patients, and to explain to patients what outcomes can be expected in terms of the probability of each outcome. Treatment decisions ultimately are based on the likelihood that the treatment will reduce the probability of a poor outcome. For example, if a child is diagnosed with leukemia, the physician may want to present to the parent the various treatment options and explain the degree to which each option will reduce the risk of death from that disease. In that way, the physician and parent both understand the potential risks and benefits of each possible treatment approach. Risk Reduction statistics are part of a group of statistics emerging from epidemiology concepts that have been found useful in evidence-based practice because they can be used to assist practitioners to decide whether or not an individual patient is likely to benefit from a particular treatment intervention (3).
Risk statistics essentially report the difference between the likelihood (risk) of an undesirable outcome for an untreated patient, and the likelihood of that outcome for a patient that receives a particular treatment intervention. The risk reduction statistics most commonly used in clinical practice treatment decisions are “absolute risk reduction” and “relative risk reduction”. In addition, clinicians need to understand the statistic, “number needed to treat”. The “number needed to treat” statistic typically gives clarity of meaning to the risk reduction statistics. The concept of risk reduction emerged from epidemiology and public health. The risk reduction statistics are based on experience with populations. When the clinician uses these statistics to inform treatment decisions, it is important that the clinician understands the population upon which the statistics were reported, and the extent to which the individual being treated fits into that population.
Absolute risk reduction
When a clinician prescribes a drug to treat an illness, the purpose is to either cure the illness or to reduce the likelihood that a secondary effect of the illness will occur. For example, when a septic patient is treated with an antibiotic, the goal is to cure the patient. Another way to view that goal is that the purpose of the antibiotic is to reduce the patient’s risk of death from the infection. In the chronic illness population, treatments are prescribed to reduce the risk of disability and secondary illnesses related to the chronic illness. For example, medications are prescribed to patients with rheumatoid arthritis to reduce the risk of further joint deformity, pain and the risk of a decrease in the patient’s ability to perform activities of daily living (ADLs). It is known that some patients will respond better to treatment than others, and the overall population statistics related to treatment outcomes can be discussed in terms of the extent to which the treatment reduces the risk of an adverse outcome.
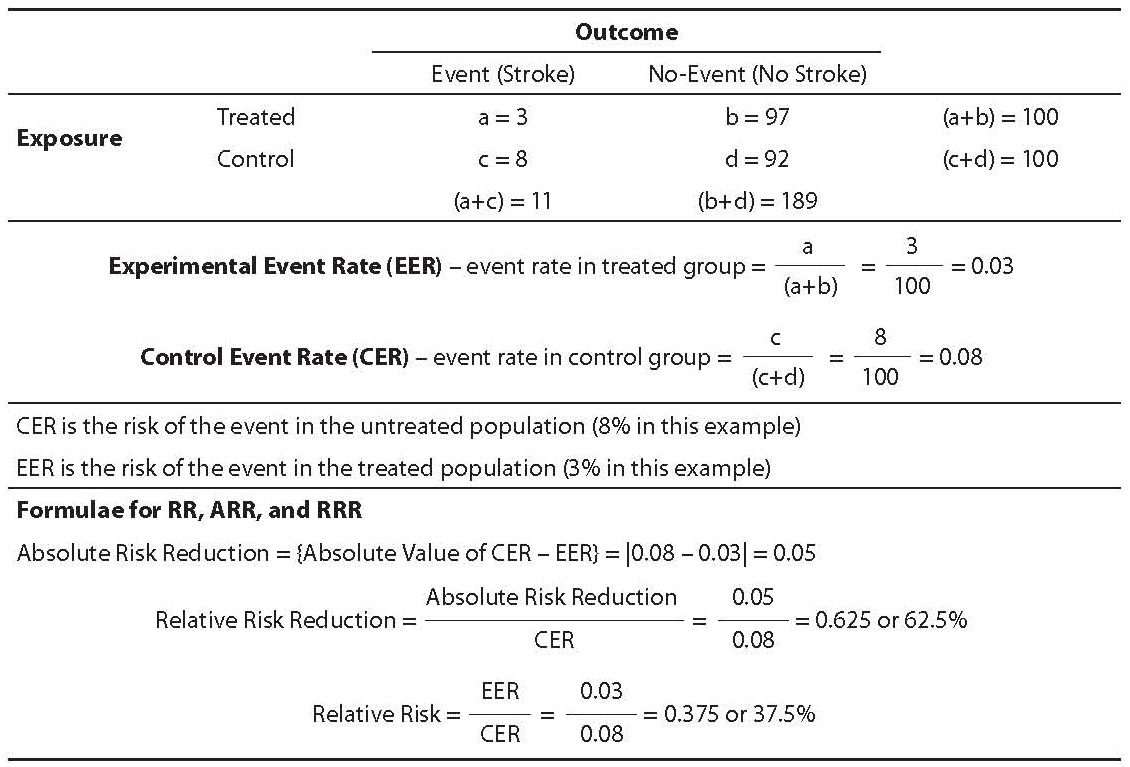
The simplest risk reduction statistic is absolute risk reduction. The calculation of this statistic requires two items of data. First, the risk of the undesirable outcome (event) in the untreated population must be known. For example, the risk of death for children with leukemia is approximately 99% if no treatment is provided. (It is important for younger individuals to know that prior to modern treatments for leukemia, virtually all children who contracted the disease died within approximately 3 months. Even up to the 1950s and 1960 when treatments extended life for most patients, most still died within 5 years and virtually all died within 10 years.) Therefore, the untreated risk of death from that disease is approximately 99%. Second, it is necessary to know the overall population risk of death given the proposed treatment. If more than one treatment is available, then the risk of death under each treatment condition must be known. For example, in 2005 the death rate from childhood leukemia in the U.S. was 27.3%. In 1990 it was 34.2% (2). The absolute risk reduction for childhood leukemia treatments in 1990 was 65.8% (100%–34.2%). The absolute risk reduction in 2005 was 72.7% (100%–27.3%). The absolute risk reduction statistic is simply the risk of death for treated children subtracted from the risk of death from untreated children. Or more generally, the statistic is calculated as the original (untreated) risk less the treated risk. Should there be more than one available treatment; the difference in risk between populations treated with each treatment can be calculated (see Table 1).
Table 1. Experimental event rate, control event rate, and risk
Relative risk and relative risk reduction
Relative risk (RR) is a very different way of looking at risk as compared to ARR. It examines the risk of the disease in the treated group relative to the risk in the untreated group. Because it is a relative risk statistic, it is not as clearly explained as absolute risk reduction. However, it provides a different perspective on the value of the treatment relative to no treatment.
RR is calculated as follows:
Let us assume that 31.6% of elderly adults in the community who do not receive the influenza vaccine will contract the disease. Let us further assume that 16.4% will contract the disease even after having received the vaccine. As we know, the ARR from the vaccine is 15.2%. Another way to describe this situation is that 68.4% of adults will remain healthy without the vaccine while 83.6% will remain healthy if they receive the vaccine.
The relative risk is calculated as follows:

The way this is interpreted is as follows: The risk of contracting influenza without the vaccine is 1.93 times the risk of contracting influenza with the vaccine (4). But this is not the same thing as the percent reduction in risk that the vaccine provides. The statistic that provides information on reduction of risk relative to having the vaccine is called Relative Risk Reduction (RRR).
Relative risk reduction is the percent reduction in risk of the event that is obtained through treatment. RRR is calculated via the following formula:
The RRR of contracting influenza for patients who receive the influenza vaccine is therefore:
The RRR expresses how much the vaccine reduces the risk of influenza disease relative to the natural, untreated risk. It can be interpreted as follows: being vaccinated will reduce the elder’s risk of influenza by 48.1% relative to the risk they incur if they refuse the vaccine.
One use of this statistic is to assist physicians and patients to decide if an expensive or painful treatment is worth the reduction in risk it offers. Given that the influenza vaccine costs only about $20.00 and influenza in the elderly can easily result in serious illness and hospitalization, or even death, the decision to be vaccinated is not very difficult. However, suppose a particular cancer treatment caused the patient great suffering from weakness, vomiting and other side-effects, and its relative risk reduction was only 5%. In that situation some patients would forego the treatment.
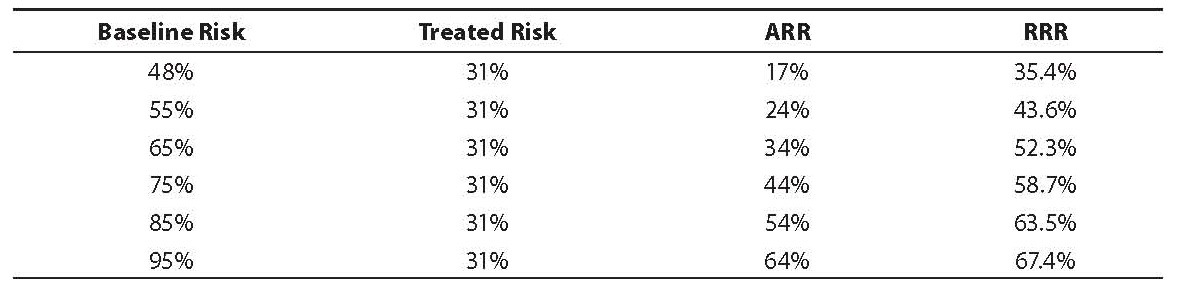
The RRR statistic is affected by the baseline risk and this fact makes its interpretation more complex than the ARR statistic. As the baseline risk rises, the RRR also increases but at a much lower rate as compared with the ARR (again, assuming the treated risk is constant) (Table 2). It is clear that at lower baseline risk levels, the RRR is much higher than the ARR, but at higher baseline risk levels, the ARR approaches the RRR.
Given the sensitivity of RRR to the baseline risk, it is important for the clinician to consider both the ARR and RRR statistics in order to understand the amount of risk reduction a drug or other treatment can achieve for a population of patients. It is also important to remember that any individual patient may benefit or not benefit from a particular intervention. These statistics predict for populations, not for individuals.
Table 2. Effect of baseline risk on relative risk reduction