Introduction
Tumor markers are used for the cancer risk estimation, early detection of the disease, screening, diagnosis, prognosis, prediction of therapy success and detecting the recurrence or monitoring progression of the disease. However, there is no tumor marker sufficiently specific and sensitive for healthy population screening. Monoclonal antibodies are used for determination of specific serum antigen, produced by the tumor cells or cells induced by host tumor cells (1).
Carcinoembryonic antigen (CEA) was first described more than three decades ago, when its presence was demonstrated in fetal gut tissue and in tumors from gastrointestinal tract. Subsequently, CEA was detected in the circulation of patients and recognized as a serum marker for colorectal cancer. This tumor marker has not been advocated as a screening test for colorectal cancer; however a preoperative CEA serum level is useful for diagnosis and prognosis of recurrence and survival in colorectal cancer patients. The levels of CEA increased with increasing tumor stage (2,3).
Carbohydrate antigen (CA) 19-9 is most valuable as a serum marker for pancreatic and biliary cancer, but increased concentrations occur in several other GI malignancies (e.g. gastric, colorectal, liver cancer and also in breast, lung, and gynaecological cancers). However, elevated levels may also occur in benign diseases. Serum CA 19-9 concentrations are elevated in 70-90% of patients with pancreatic cancer; the concentrations reflect tumor burden and high concentrations are associated with adverse outcome. Post-therapeutic monitoring of marker levels provides information on treatment response and recurrence (3-5).
Alfa-fetoptotein (AFP) is a hepatocellular carcinoma marker. It is used for the diagnosis, prognosis, detecting recurrence of the disease, monitoring of therapy as well as for high-risk population screening for development of hepatocellular malignancy (1,6). The concentration of tumor markers depends on the biological and analytical variation (7,8). Using the reagents from different manufacturers can result in a different test result in the same sample, even if the method of determination is the same (including the use of standardized antibodies). That can lead to the wrong interpretation of the results. Due to these reasons, when determining the concentration of tumor markers, quality requirements must be fulfilled, and the method of determination must be reported with the results. If the method of determination needs to be changed, it is recommended to perform simultaneous determination, using both methods (4,9,10).
The aim of our study was to perform the analytical evaluation of the inter-assay comparability for tumor markers CA19-9, CEA and AFP on two different automated chemistry analyzers. Results were obtained on the analyzers Vitros ECi (Ortho Clinical Diagnostics, Johnson and Johnson, Buckinghamshire, UK) and the Cobas e 411 (Hitachi High Technologies Corporation, Tokyo, Japan).
Materials and methods
Materials
Methods comparison was conducted using routine patient samples analyzed for the purpose of the standard diagnostic work-up in our hospital. 38 sera samples for CA19-9 and AFP, and 39 sera samples for CEA. The tested samples were from hospitalized patients with clinical suspicion or confirmed diagnosis of gastrointestinal carcinomas admitted to the Department of Nuclear Medicine, Dubrava University Hospital in the period of March 21st to March 31st 2009. Each serum was divided into two aliquots immediately after centrifugation – one to determine the concentration of markers on the Vitros ECi analyzer at the Department of Nuclear Medicine, Dubrava University Hospital, and the other to determine the concentration of the markers on Cobas e 411 analyzer at Clinical Department for Laboratory Diagnostics, Dubrava University Hospital. Sera were obtained after centrifuging at 1006 x g for 10 minutes in Hettich Rotina 35 R (Hettich, Tuttlingen, Germany) centrifuge. In addition to analyzing the samples on Vitros ECi analyzer, values of BioRad, Lypochek Immunoassay Plus (Bio-Rad Laboratories, Marnes-la-Coquette, France; Control lot 40200 - Level 1, 2 and 3) control samples were obtained for CEA and AFP. For CA19-9, Vitros Immunodiagnostic Product Oncology Controls (Ortho Clinical Diagnostics, High Wycombe, UK; Control lot 220) were obtained. In addition to analyzing the samples on Cobas e 411 analyzer, values of control samples PreciControl Tumor Marker (Roche Diagnostics GmbH, Mannheim, Germany; Level 1 and 2; Control lot 150568) were obtained.
Methods
Concentrations of tumor markers in sera and control samples were determined on the Vitros Eci analyzer with chemiluminiscence assay (imunometric) and on the Cobas e 411 analyzer with electrochemiluminiscence assay according to the manufacturer instructions.
Control samples were tested every day during the 10 days study period.
Analytical inaccuracy was shown as bias (%) and day-to-day imprecision as coefeicient of variation CV (%).
Quality requirements for the tests were stated according to Westgard rules (derived from biological variations).
Expected ranges provided by the manufacturer were as follows: 0-31.3 kIU/L for CA 19-9, 0-6.5 µg/L for CEA and 0-7 µg/L for AFP for Cobas e 411 analyzer and 0-37 kIU/L for CA 19-9, 0-5 µg/L for CEA and 0-7.51 µg/L for AFP for Vitros ECi analyzer.
Statistical analysis
Mean, minimal and maximal measured values, as well as the coefficient of variation and bias, were calculated for control samples.
Median value, 95% CI, minimal and maximal value were calculated for tested samples.
Correlation of CA19-9, CEA and AFP results was preformed and Spearman correlation coefficient was calculated. The level of significance was set at P < 0.01. Passing-Bablok regression was used for method comparison for each tumor marker, including the Cusum test for linearity. Statistical analysis was performed using MedCalc 10.1.2.0 software (MedCalc, Mariakerke, Belgium).
Results
The measured values of commercial control samples were within the range recommended by the manufacturer. Results of the day-to-day imprecision and bias were in the range of desirable specificiations derived from biological variations. Declared and measured values of control samples, as well as their bias and CV% from day-to-day imprecison are presented in the Tables 1 and 2.
Table 1. Comparison of the declared values of commercial control samples for CEA AFP and CA 19-9 on Vitros ECi analyzer with the obtained values
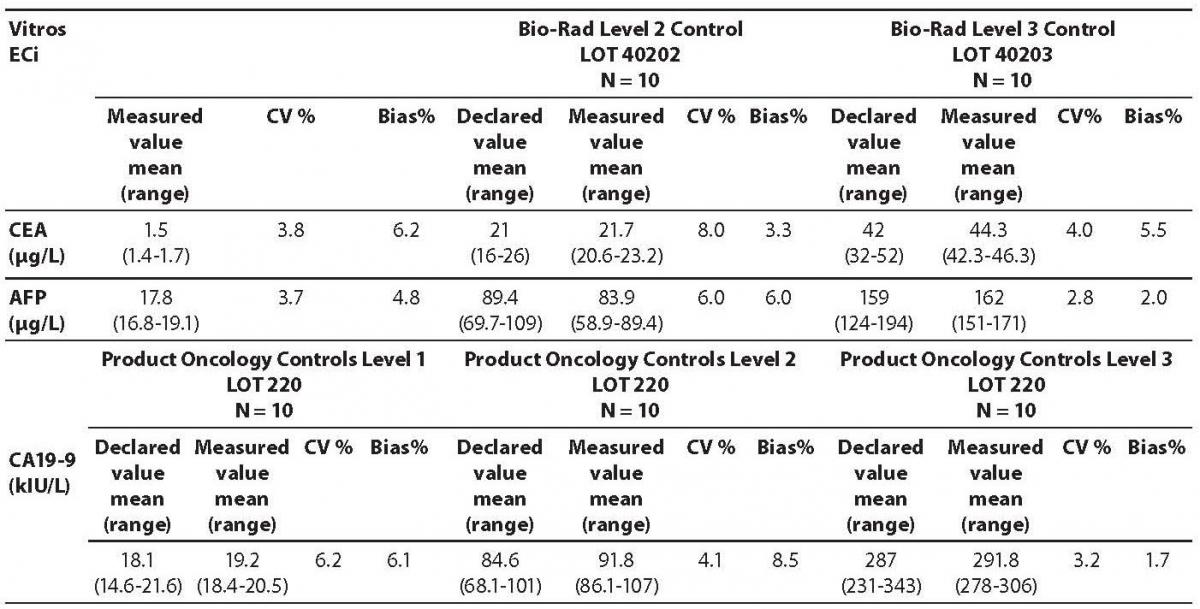
Table 2. Comparison of the declared values of commercial control samples for CEA, AFP and CA19-9 on Cobas e411 analyzer with the declared values
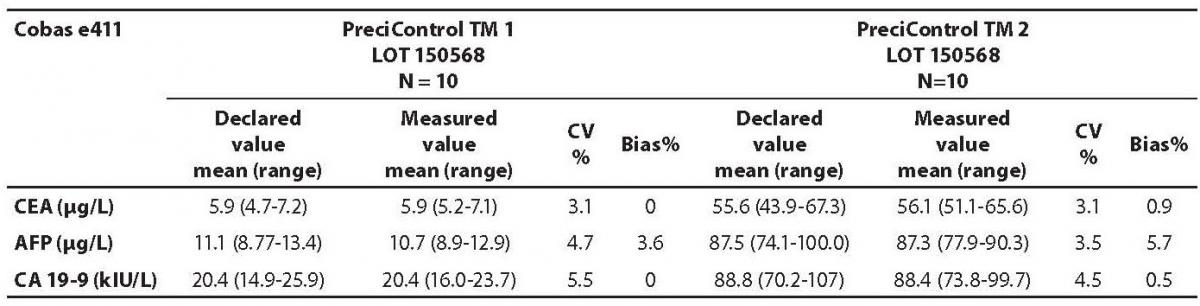
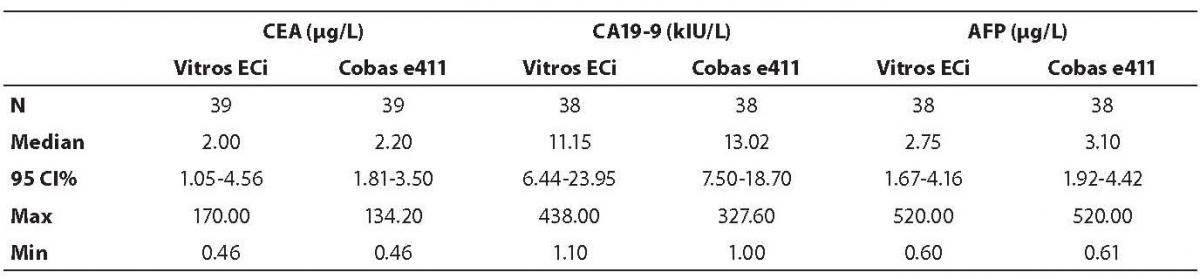
The highest deviation from the declared control values was found for CA19-9 on Vitros ECi and for AFP on Cobas e 411 analyzer. Overall descriptive statistics is presented in Table 3. Correlation coefficients of tumor markers concentrations obtained in the tested samples on Vitros ECi and Cobas e 411 were as follows: 0.978 for CA 19-9, 0.995 for CEA and 0,999 for AFP (P < 0.001).
Table 3. Descriptive statistics of the obtained patients’ values for all tumor markers
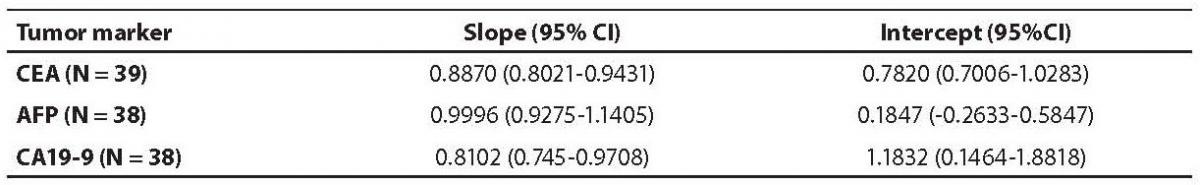
The Cusum linearity test performed on Passing-Bablok regression showed that there was no significant deviation from linearity (P > 0.01). Passing-Bablok regression results for CEA, AFP and CA 19-9 are shown in Figures 1, 2 and 3 and in Table 4.
Figure 1. Passing-Bablok regression plot for CA 19-9 determined on Vitros ECi and Cobas e 411
Figure 2. Passing-Bablok regression plot for CEA determined on Vitros ECi and Cobas e 411
Figure 3. Passing-Bablok regression plot for AFP determined on Vitros ECi and Cobas e 411
Table 4. Passing-Bablok regression data – slope and intercept with 95% CI
Discussion
The aim of the study was to verify our daily routine experience with comparability of tumor markers concentrations obtained with different methods on different analyzers. Concentrations of all three markers in control samples obtained on both analyzers (Vitros ECi and Cobas e 411) performed well in terms of target values declared by the manufacturer, but differed between each other. The highest deviation from the declared control values was found for CA19-9 on Vitros ECi and for AFP on Cobas e 411 analyzer. An interesting fact is that the largest deviation from the declared values for Vitros ECi analyzer was in the normal and slightly elevated range of values of the control sera (Level 1 and 2). That does not include CEA that showed the largest deviation in the normal and high range of the control sera (Level 1 and 3). It is important to emphasize that the correlation coefficients for all three markers showed a high correlation of their specific concentration obtained on both analyzers. Data obtained using Passing-Bablok regression showed concentrations of CEA and CA 19-9 not to be aligned nor to follow the same linearity (slope and y-axis intercept did not include 1 or 0), while the concentrations of AFP obtained on two analyzers were aligned and followed the same linearity (slope and y-axis intercept included 1 or 0). From these data we can conclude that there is no proportional difference between the results of CEA and CA19-9. Therefore, comparability of the concentration of tumor markers on two different analyzers is not satisfactory. Concentrations of AFP obtained on two analyzers met the preferences of Passing-Bablok regression; the slope was very close to 1, and y-axis intercept was very small. Regardless of high correlations, it is evident that there are differences in values obtained with different methods on different analyzers, and that cannot be ignored. WHO international standards for CEA and AFP are available (CEA-IRP 73/601; AFP IRP 72/225) (4,9) and that should ensure standardized and accurate calibration, but nonetheless there are clear differences in the results obtained on two studied analyzers. Previous studies in this field indicate that CA 19-9 assay shows significant differences between methods and that results cannot be extrapolated from one analytical tehnique to another (4,11,12). Differences in values for CEA and AFP could be explained with the usage of antibodies with different specificities. For of CA19-9, both methods use the same antibody (1116-NS-19-9), which suggests that differences in CA19-9 results obtained on two different analyzers are the consequences of the calibration and method design (e.g. use of different markers). From all the presented results we can conclude that there are significant differences in the results of tumor markers concentrations for individual patients tested on different analyzers and with different methods. Considering the number of studied samples is very small to make any strong conclusions, this limitation should be taken into consideration when interpreting our results. Another limitation of the study is lack of background information for the patients.
It is important to monitor the values of tumor markers of each patient with the same reagents on the same analyzer despite their comparability and high correlations (13-16). The biggest problem is the long-term monitoring, because in a course of one year the patient can change hospital or the laboratory can introduce a new method of determination of tumor markers. Ideally, the results obtained by different methods should be fully comparable, but as the outcome of this study shows, that is not noted in practice. In cases where the latter is not possible, when changing the methods and analyzers, it is necessary to define a new baseline concentration of tumor markers for monitoring each patient.