Introduction
Careful monitoring of drug concentration (therapeutic drug monitoring, TDM) is essential for a large number of drugs. Drugs with narrow therapeutic range can easily achieve either too high or too low serum concentration. Elevated drug concentration in the bloodstream can cause side effects with serious and sometimes even fatal consequences. On the contrary, drug concentration below the therapeutic range can lead to inadequate response to therapy.
Valproic acid, phenobarbital and carbamazepine are antiepileptic drugs (AEDs) that have been used for treatment of seizures in epilepsy and other disorders (1–3). These drugs require constant monitoring to maintain the concentration within the therapeutic range. Although, novel second- (4) and third-generation (5) antiepileptics have now days been prescribed more frequently, these drugs still remain treatment of choice for some types of pediatric epilepsy (6).
Theophylline is a bronchodialatator with a narrow therapeutic range and large interindividual variability in pharmacokinetics. High serum concentrations of theophylline are associated with serious adverse reactions. Although its use has been declining in the past two decades, it is still used as an additional treatment drug in the asthmatic acute phase in children (7,8).
In our laboratory, TDM is performed using fluorescence polarization immunoassay (FPIA) technology on TDx FLx Abbott analyzer (Abbott Laboratories, Abbott Park, IL, USA). For methods based on antigen-antibody reaction a large variability between different types/generations of reagents can be observed (9). Our experiences have shown that even interchangeable analytic systems of the same kind of analyzers can show discrepancies in a result and should be carefully monitored and compared (10). Furthermore, as a laboratory accredited according to ISO 15189 standard, we are obliged to perform an analytical validation of each new reagent/analyzer prior to method verification and introduction to routine laboratory work (11).
Aim of this paper was to describe the results of analytical validation of Abbott AxSYM analyzer for therapeutic drug monitoring of valproic acid, phenobarbital, carbamazepine and theophylline.
Materials and methods
Methods
This study was performed at University Department of Chemistry, Sestre milosrdnice University Hospital in November 2009. Concentration of therapeutic drugs theophylline, carbamazepine, phenobarbital and valproic acid was determined on AxSYM analyzer (Abbott Laboratories, Abbott Park, IL, USA) using original manufacturer’s reagents and procedures. For the comparability study, valproic acid was determined on Abbott TDx FLx analyzer (Abbott Laboratories, Abbott Park, IL, USA). All analytes were determined by fluorescence polarization immunoassay (FPIA) technology.
Therapeutic intervals used in our laboratory were as follows: for theophylline 28–83 µmol/L; for carbamazepine 17–42 µmol/L; for phenobarbital 65–172 µmol/L and for valproic acid 347–693 µmol/L.
Analytic evaluation
Inaccuracy
Inaccuracy was determined using three concentration levels of the commercial control samples. Lot numbers for control samples were: 69072Q100 for Theophylline II Control; 76484Q100 for Carbamazepine Control; 69641Q100 for Phenobarbital Control and 76480Q100 Valproic Acid Control (Abbott Laboratories, Abbott Park, IL, USA). Each sample was analyzed three times; average result was compared to manufacturers declared value and the bias was calculated. Acceptance criteria for each analyte were established according to the CLIA Proficiency Testing criteria (12).
Within run imprecision (repeatability)
Repeatability was determined using sera of two patients for each analyte (samples A and B). Each sample was analyzed ten times in a batch analysis. Coefficient of variation (CV) was calculated and compared to the acceptance criteria declared by the manufacturer for appropriate concentration levels, as well as to criteria proposed by Guidelines of the German Federal Medical Council (13).
Between run imprecision (intermediate precision)
Intermediate precision was determined using pool of three patients’ samples for each analyte. These samples were remaining sera from the routine drug monitoring analysis. Samples were mixed and aliquoted in ten separate tubes and frozen at –20 C. During the 15-days period, once a day at different time of the routine work one sample was thawed and analyzed. Coefficient of variation was calculated and compared to the acceptance criteria declared by the manufacturer, as well as to criteria proposed by Guidelines of the German Federal Medical Council (13).
Measurement uncertainty
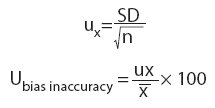
Measurement uncertainty (U) was calculated for all tests according to the formula (14):

Where:
Ucalibratoris acalibrator measurementuncertainty as declared by the manufacturer.
Uimprecisionis anuncertainty caused by imprecision. In our case, coefficient of variation for between run imprecision was used.
Ubias is an uncertainty caused by inaccuracy. In our case, bias of the commercial control sample with the value closest to the sample for the between run imprecision was used.
Ubias inaccuracyis an uncertainty caused by inaccuracy when calculating bias. It is calculated using following formulas:
Method comparison
Method comparison was done using remaining sera for the patients referred to laboratory for valproic acid determination. For 30 patients, valproic acid was determined on the Abbott TDx FLx analyzer as a part of a routine workup and than immediately analyzed at AxSYM Abbott analyzer.
Statistical analysis
Data on the commercial control samples are presented as arithmetic mean and the bias to the manufacturers’ declared value was calculated. For the imprecision analysis, minimum, maximum, arithmetic mean, standard deviation and coefficient of variation were calculated. For the comparison analysis, valproic acid concentration is presented as mean ± standard deviation and Passing-Bablock regression analysis (along with Cusum linearity test) was performed. Statistical analysis was performed with MedCalc® software (MedCalc 10.1.3.1., Frank Schoonjans, Mariakerke, Belgium).
Results
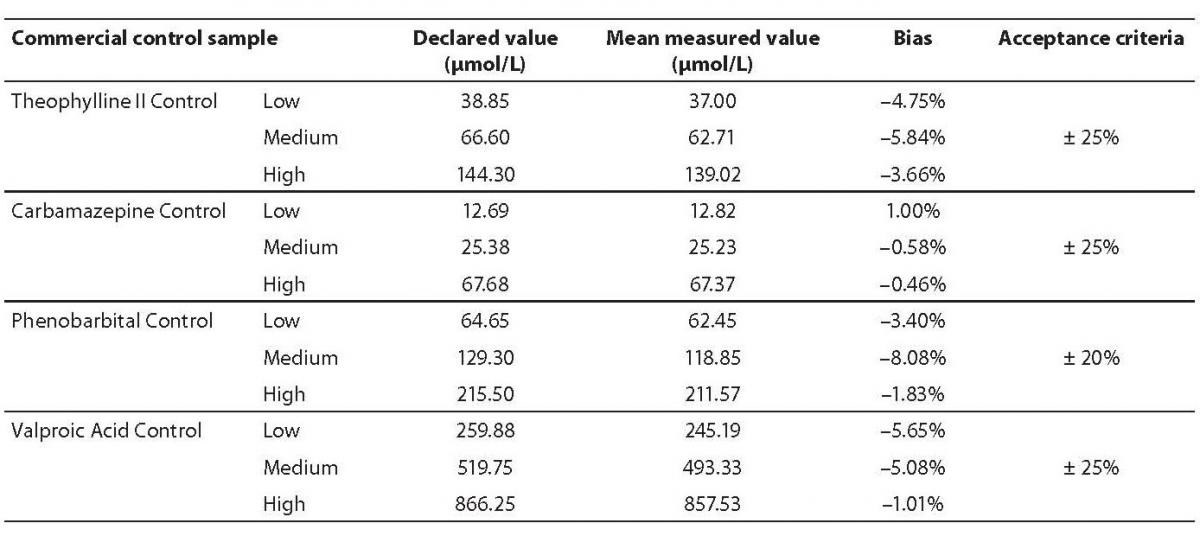
Inaccuracy for all analytes was in accordance with the previously established criteria (Table 1). The highest bias was observed for the Phenobarbital Medium Control (–8.08%), but it was also within the acceptance criteria.
Table 1. Results of inaccuracy analysis.
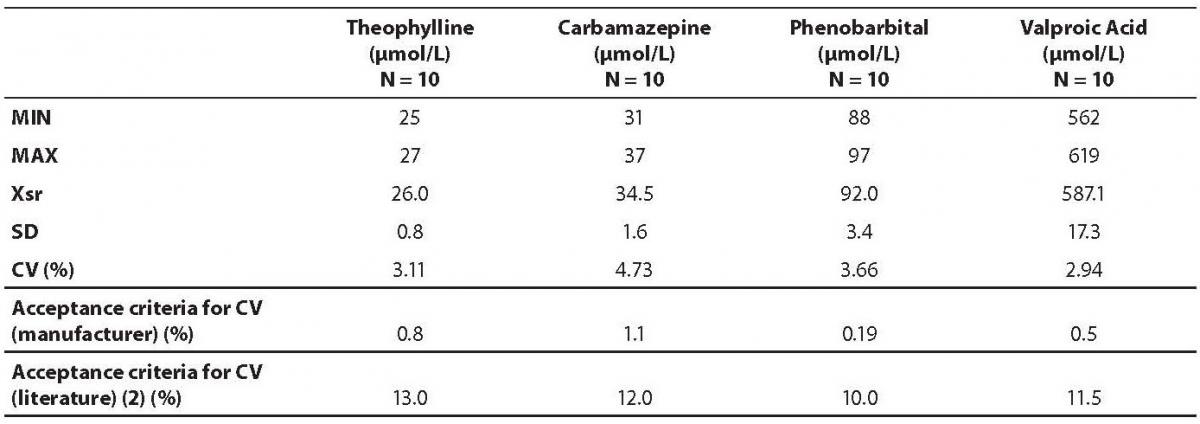
Data on within run imprecision (repeatability) are presented in table 2. The highest coefficient of variation was observed for the phenobarbital assay (7.07%) and the lowest for the theophylline (2.71%). Table 3 shows the data on between run imprecision (intermediate precision). The highest coefficient of variation was observed for the carbamazepine (4.73%) and the lowest for the theophylline (2.94%). None of the obtained coefficients of variation met the criteria declared by the manufacturer. However, all values fulfilled the requirements as proposed by the German Federal Medical Council (13).
Table 2. Results of within run imprecision analysis.
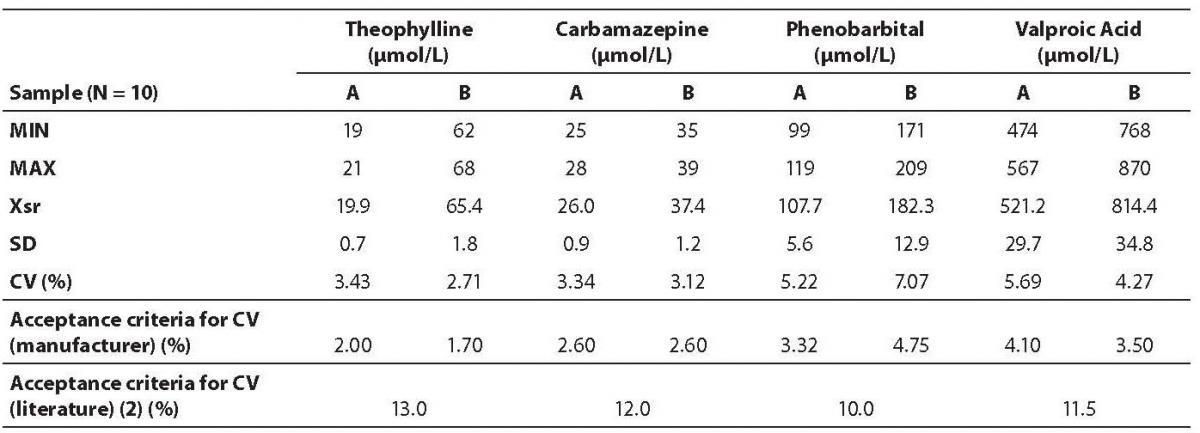
Table 3. Results on between run imprecision analysis.
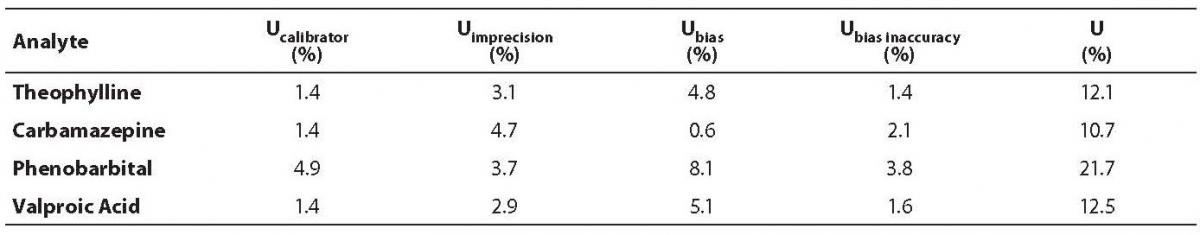
Measurement uncertainty was calculated for all analytes according to the previously described formula (14) (Table 4). The highest uncertainty was observed for phenobarbital (21.7%), which was expected, since the highest inaccuracy and coefficient of variation were also observed for the same analyte.
Table 4. Measurement uncertainty results.
Comparison of valproic acid concentration determination on two analyzers is presented in table 5 and figure 1. Passing-Bablock regression analysis showed statistically significant, but clinically insignificant deviation in slope of the regression equation (b = 1.121; 95% CI = 1.028–1.197); however the Cusum linearity test proved that there was a linear relationship between two methods.
Table 5. Passing-Bablock regression analysis.
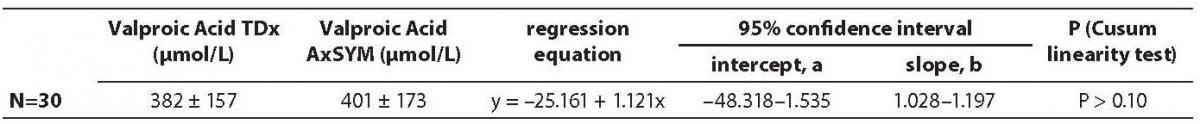
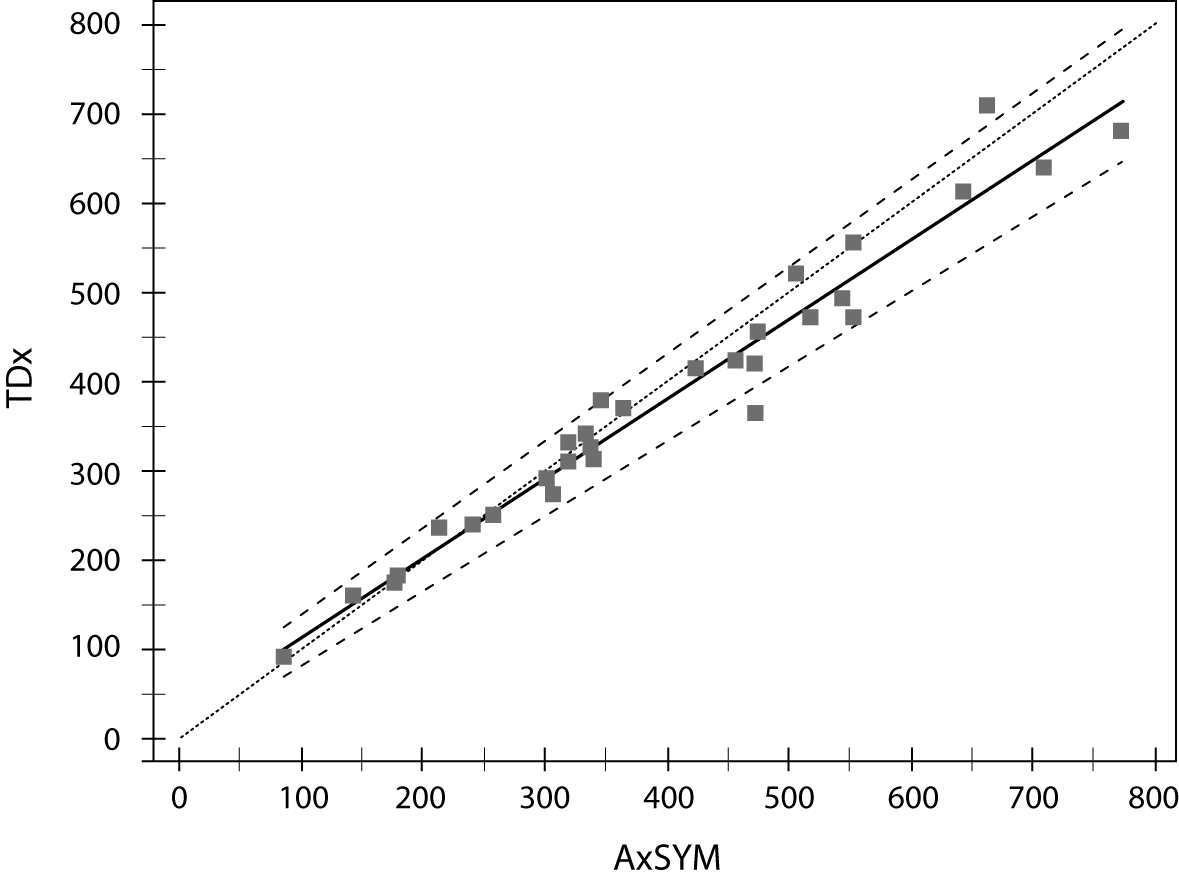
Figure 1. Comparison of valproic acid concentration determination on two analyzers (Abbott TDx and AxSYM).
Discussion
The aim of this study was to evaluate TDM assays on Abbott AxSYM analyzer. Overall, all obtained parameters were satisfactory and fulfilled previously established criteria.
Inaccuracy study showed the highest bias for phenobarbital assay (–8.08%), for the medium control concentration level of 129.30 (99.56–159.04) μmol/L, surprisingly, since one could expect the highest error for the highest concentration values. However, this concentration range is within the reference range of phenobarbital monitoring (65–172 µmol/L) and not near the critical value that is associated with the increased risk of side effects (> 220 µmol/L). Due to that, we believe that inaccuracy couldn’t have high clinical impact. Nevertheless, the proposed acceptance criteria for toxicology TDM by CLIA Proficiency Testing criteria are much higher than those obtained in our evaluation (12).
Imprecision analysis showed similar CVs in within run and between run studies. Moreover, for some assays (valproic acid and phenobarbital) CVs obtained in between run analysis were even smaller than those in the batch analysis, suggesting a great stability of performance for these assays. However, neither of obtained coefficients of variation fulfilled the criteria established by the manufacturer. It could be expected, since the manufacturer defined those CVs using commercial control samples as the material of the analysis. In our study, we wanted to simulate the conditions of routine laboratory work and we have determined our imprecision using patients’ samples. Our obtained CVs also fulfilled acceptance criteria established by the German Federal Medical Council (13).
We have decided to expand our analytical validation by presenting results of measurement uncertainty. Measurement uncertainty encompasses all components tat can influence on the result: systematic and random error parameters of the assay and errors obtained by uncertainty of calibrators and it’s estimate (15). Measurement uncertainty is still not fully implemented in a standard laboratory evaluations, since one could be puzzled by “high” numbers usually obtained in this analysis. Since the measurement uncertainty is a property of an each measurement result, we are obliged to give an estimate of range where our result is positioned in order to ensure to the users of our analysis a true interpretation of obtained value. Measurement uncertainties for our validation were also satisfactory (~10–20%), since we could expect these values for immunochemistry analysis (16).
Since all tested analytes utilize the same technology (FPIA), we have decided to make the comparison between two analytic systems only for one representative analyte – valproic acid. Comparability study also showed a satisfactory concordance between valproic acid determinations on two analyzers. When we have to replace an analytic system in a routine laboratory practice, it is very important not to have a constant deviation from the result. In that case, a reference range should be modified in order to maintain a correct interpretation of laboratory result and ensure proper TDM for the patient. The small deviation in slope of the regression line that we have observed in our analysis was in the high concentration range (Figure 1) and that small difference has no clinical implication on interpretation of the result. Our conclusions should be confirmed on larger number of samples, since the low number of valproic acid determinations used in our comparability study is a limitation to our work.
In conclusion, our analytical validation fulfilled all previously established criteria and could be implemented in a routine laboratory work. We could replace our existing system with a new analyzer without having influence on the result of therapeutic drug monitoring for patients.
Acknowledgments
The authors wish to thank Abbott Laboratories Ltd., Croatia for providing reagents for this evaluation.