Introduction
The Editors at Biochemia Medica are committed to continuously improve the quality of the articles published in the Journal. This may be achieved by helping authors to improve their manuscripts through peer-review process. One of the major problems in manuscripts submitted to Biochemia Medica is the quality of the data analysis and data presentation. The improper use of statistical methods is unethical because it leads to biased results and incorrect conclusions. Moreover, this is a substantial waste of time and money. The most common errors occurring in Biochemia Medica have already been reported in this Journal (1).
To improve the quality of data analysis and reporting in manuscripts submitted for possible publication, the increasing number of journals have issued statistical guidelines and have also introduced the statistical editors who are responsible for statistical peer-review (2-4).
The aim of this article is to provide practical recommendations for authors who wish to submit their work to Biochemia Medica. It should however be made clear that this article by no means provides a substitute for a comprehensive textbook in biostatistics. On contrary, readers are encouraged to take this only as a reminder and to consult a textbook for a more comprehensive coverage of the issues mentioned in this article.
Are key results included in the Abstract?
One of the most important parts of the article is the Abstract. Authors quite often forget that Abstract is sometimes the first (and only) part of the article read by the readers. As stated in the Instructions to authors, Abstract for all original articles must be structured into following four headings: Introduction, Materials and methods, Results and Conclusions. Furthermore, Abstract must be comprehensive and provide key results of the study. If not done so already in the Materials and methods section of the Abstract, authors certainly need to make sure that readers are informed about the number and size of the studied groups. All estimates need to be presented with the appropriate summary measures, confidence intervals and P values (where applicable). For all tested differences and associations, the level of significance must be provided.
Below is the example for poorly written Results section of the Abstract:
Results: The concentration of New BioMarker™ in patients with acute myocardial infarction was higher than in healthy controls (P < 0.05). There was a significant correlation of New BioMarker™ with serum copeptine concentrations.
Results: The concentration of New BioMarker™ in patients with acute myocardial infarction was higher than in healthy controls (P < 0.05). There was a significant correlation of New BioMarker™ with serum copeptine concentrations.
The following is the example for well written Results section of the Abstract:
Results: There were 250 patients with acute myocardial infarction and 232 healthy controls. The concentration of New BioMarker™ was higher in patients than in healthy controls (7.3 ± 0.6 mmol/L vs. 5.4 ± 0.5 mmol/L, respectively; P = 0.002). New BioMarker™ was associated with serum copeptine concentration (r = 0.67, P = 0.026).
Results: There were 250 patients with acute myocardial infarction and 232 healthy controls. The concentration of New BioMarker™ was higher in patients than in healthy controls (7.3 ± 0.6 mmol/L vs. 5.4 ± 0.5 mmol/L, respectively; P = 0.002). New BioMarker™ was associated with serum copeptine concentration (r = 0.67, P = 0.026).
Is Statistical analysis section written well, accurate and comprehensive?
Problematic section often neglected by authors is Statistical analysis as the subheading within the section Materials and methods. Within the subheading Statistical analysis authors need to explain which statistical tests were used in their data analysis and the rationale for using those tests. Care must be taken to assure that: a) all tests used are listed in the Materials and methods under Statistical analysis, as well as b) that all tests listed are indeed applied in the study. From this section, every reader should be able to understand which test exactly was used for every comparison of the data presented with the Results section. At the end of the Statistical analysis, authors need to state the level of significance applied in their study and statistical program used.
When writing the section Statistical analysis, authors need to make sure to address all issues listed below:
- What kind of data did they have (categorical or numerical)?
- How did they describe their data?
- Did they test their distributions for normality? The name of the normality test needs to be stated.
- How was statistical test chosen to test the possible differences and associations between their data?
- Which statistical test was used for analyzing their categorical data?
- Were the groups large enough to detect the expected effect?
- What was the level of significance in their analysis?
- Which statistical software did they use? The version of the software and complete information on the manufacturer of the statistical software must be provided.
The following is the example for poorly written Statistical analysis subheading of the Materials and methods section:
Statistical analysis
Data were presented as mean ± standard deviation. Differences were tested by t-test. Pearson correlation was used to analyze the association between all studied parameters. Data analysis was done using MedCalc.
Statistical analysis
Data were presented as mean ± standard deviation. Differences were tested by t-test. Pearson correlation was used to analyze the association between all studied parameters. Data analysis was done using MedCalc.
The following is the example for well written Statistical analysis subheading of the Materials and methods section:
Statistical analysis
The Kolmogorov-Smirnov test was used to assess the normality of distribution of investigated parameters. All parameters in our study were distributed normally. Data were expressed as mean ± standard deviation. Differences were tested by two-tailed t-test. Pearson’s correlation was used to analyze the association between all studied parameters. The values P < 0.05 were considered statistically significant. Statistical analysis was done using MedCalc 12.1.4.0 statistical software (MedCalc Software, Mariakerke, Belgium).
Key points to keep in mind when writing the Results section
The next section that should be carefully inspected prior of submitting, to detect for any possible flaws and errors in data analysis and presentation is Result section.
When results are reported, authors need to make sure that:
- Their descriptive analysis is appropriate;
- They have presented their results with adequate precision and accurately;
- They have provided the measure of confidence for all estimates, if necessary and applicable;
- They have used correct statistical tests for their analysis;
- Their graphs and tables are informative;
- They have provided P value for all tests done in their work;
- They are not making any conclusions on the causal relationship unless their study is an experiment or a clinical trial.
This is, unfortunately, not always the case. Authors quite often fail to describe their data with adequate precision and by using the appropriate summary measures. Quite often, it is not clear from the text whether the assumptions for tests were met and have appropriate tests been used in the data analysis. This part of the manuscript is crucial and needs to be written with great attention and care. To help our readers to avoid all possible mistakes below we summarize some key points they need to keep in mind when writing Results section of their manuscripts.
Is the descriptive analysis adequate?
When describing numerical data, it is essential that proper measures of central tendency and dispersion are used. Before presenting the data, normality of the distributions needs to be tested. Generally speaking, if the data are normally distributed and if sample size is ≥ 30, parametric summary measures (mean and standard deviation) may be used. However, if sample size is small (N < 30) or if data are not normally distributed, authors are advised to use median and interquartile range (IQR), from first (Q1) to third quartile (Q3) or some other measures, like range. We wish to point out that there is no uniformly accepted opinion about the cut-off number for the sample size, but according to Dawson and Trapp, samples under 30 subjects per group are considered small and require non-parametric statistics (5).
Since SEM (standard error of the mean) is not the measure of dispersion, its use is not allowed when summarizing and describing the data. Using SEM instead of standard deviation is one of the ten most common mistakes occurring in the manuscripts submitted to biomedical journals (6).
More extensive review on the ways of summarizing and interpreting numerical data has recently been published in this journal within the section Lessons in biostatistics (7) and elsewhere (8).
Are results presented with adequate precision and accurately?
The golden rule is to present the data with the precision which corresponds to the precision of the raw data obtained by the measurement. For instance, when reporting the number of cigarettes smoked in some studied period, it is completely unnecessary and wrong to state that the number of cigarettes was: 10.21 ± 3.16. This is wrong because the reported precision does not correspond to the precision of the measurement. The number of cigarettes is measured by counting. So, the observed number of cigarettes should be the whole number, without any decimals: 10 ± 3.
Example for the flawed data presentation of the observations is provided in the Table 1a.
The problem with data presented in Table 1a is that all three parameters were presented with inadequate precision which does not correspond to the precision of the way those data were measured:
- Age is usually expressed with years and only one decimal is allowed, if absolutely necessary. Only when children are studied, it makes sense to provide age in months and even days. Moreover, age is usually reported as median and range (min-max). So, instead of stating that average age was 55.905 ± 2.112 years, it needs to be stated that the average age was 56 (51-60) years.
- The mean and measure of dispersion (standard deviation) for all laboratory parameters needs to be presented with as many decimals as the results are usually reported on the laboratory test report. It is therefore improper to present the WBC data with three decimals, since this parameter is usually measured and reported with only one decimal. So, instead of stating that WBC number in group A was 13.177 (6.837-15.272) x 109/L, authors should report that WBC was 13.2 (6.8-15.3) x 109/L.
- Finally, due to the small number of subjects in both groups, the ratio of females in both groups needs to be provided as the number of the observations divided with the total number of subjects within the group (6/11 and 8/14 instead of 54.5% and 57.1%).
- General rules when reporting frequencies are listed below:
- Percentages are not recommended if the number of subjects in the group is < 100. Instead, ratios should be used (for example, 0.67 instead of 67%).
- Percentages should be presented as whole numbers, without decimals. The exception are percentages < 10%, where one decimal place is allowed, only if necessary and applicable (for example, if percentage is 0.3%).
- For small samples (N < 30), the use of percentages and ratios is not recommended. When their sample size is small, authors are advised to present their data with the number of the observations divided with the total number of subjects within the group (for example, 3/11, instead of 27%).
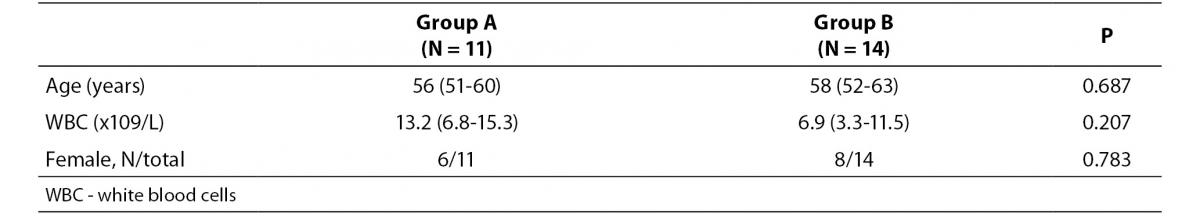
Correct way to present data is provided in Table 1b.
Table 1a. The example for erroneously presented results for observations in two groups (groups A and B).
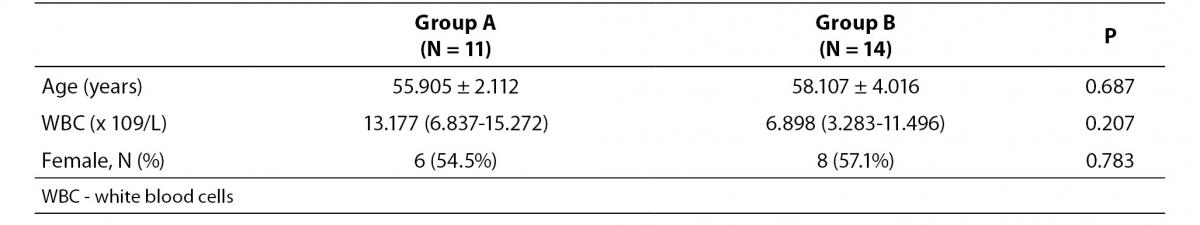
Table 1b. The example for correctly presented results for observations in two groups (groups A and B).
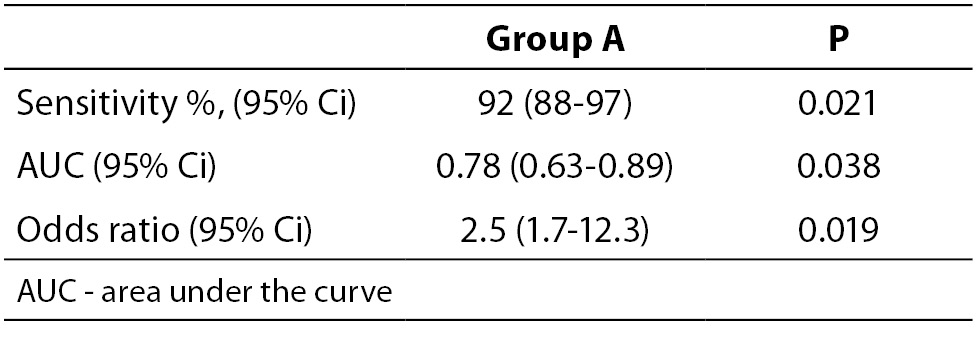
When necessary and applicable, the authors need to make sure to provide the measure of confidence and P value for all their estimates. This is especially important when presenting estimates of diagnostic accuracy, odds ratios, relative risks, regression analysis results etc. In the Tables 2a and 2b, we list some most common examples for flawed and correct presentation of your estimates.
Table 2a. Examples for flawed presentation of results.
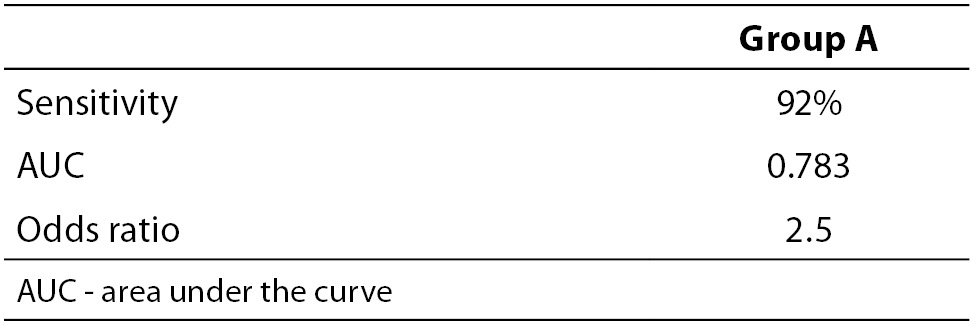
Table 2b. Examples for correct presentation of results.
The reason why confidence intervals are important is because they show how precise is the corresponding estimate. If confidence interval is too wide, this means that the precision of the estimate is small. Confidence intervals may be used to assess the difference between two estimates. For example, if authors wish to compare two areas under the curve (AUC) for two parameters, it needs to be checked if their confidence intervals overlap. In case those two confidence intervals overlap, it may be concluded that there is no statistically significant difference in the AUC for those two parameters at the corresponding level of significance relative to the confidence interval. More extensive review on the use and interpretation of the confidence intervals has already been published in this Journal within the section Lessons in biostatistics (9).
Example:
Let us say that we wish to compare the AUC for parameter A and B. Their AUC and corresponding 95% confidence intervals are 0.78 (0.63-0.89) and 0.99 (0.80-0.99). The question is: is there a statistically significant difference in the AUC for parameters A and B? Since their 95% confidence intervals overlap (from 0.80 to 0.89) we may conclude that there is no statistically significant difference in those two parameters, for the significance level alpha = 0.05.
Let us say that we wish to compare the AUC for parameter A and B. Their AUC and corresponding 95% confidence intervals are 0.78 (0.63-0.89) and 0.99 (0.80-0.99). The question is: is there a statistically significant difference in the AUC for parameters A and B? Since their 95% confidence intervals overlap (from 0.80 to 0.89) we may conclude that there is no statistically significant difference in those two parameters, for the significance level alpha = 0.05.
It is noteworthy to mention that AUC is always reported with two decimal places, as well as its upper and lower 95% confidence interval limits.
Were correct statistical tests used for the analysis?
The choice of statistical test is determined by the type of the data and the way they are measured. There are several assumptions that need to be checked prior to the choice of the test:
- Are data normally distributed?
- Are data numerical or categorical?
- How many groups do authors have?
- How big are the studied groups?
- Are the measurements independent?
Depending on the answers to the above listed questions, researcher makes the choice of the statistical test. Common errors are: i) authors did not test for those assumptions prior to the applying the statistical test; or ii) they fail to describe the way the test was selected; or iii) reader is not informed at all about the test used to analyze data in the study.
If data are not normally distributed and/or if sample size is small (N < 30), non-parametric tests should be used.
Tom Lang has reviewed 20 most common statistical errors occurring in biomedical research articles and has provided statistical reporting guidelines to be followed by authors, editors, and reviewers who lack some knowledge about the statistical analysis (6). Listed below are some of the most commonly errors occurring in manuscripts submitted to Biochemia Medica:
- Normality is not tested and statistical test is used without the knowledge of the data distribution, or regardless to the sample size.
- Paired statistical test is not used, although dependent observations (for example, repeated measurements) are tested.
- Chi-square test is used even if total number of observations or the number of expected frequencies in the 2x2 table is low.
- Pearson’s coefficient of correlation is calculated even if one variable is measured using the ordinal scale or data distribution significantly deviates from normal distribution.
- Differences between three or more groups are tested with t-test, instead of tests like ANOVA or Kruskal-Walis test.
If there are three or more groups, authors should use ANOVA or its non-parametric analogue. When testing the data with tests for testing differences between three or more groups (such as ANOVA or Kruskal-Walis test), authors need to make sure to give P value for ANOVA as well as for post-hoc comparisons.
Only if P for ANOVA or Kruskal-Walis test implies that the tested difference among groups is significant, authors may proceed with post hoctest for multiple comparisons. Post hoc test is not done if P > 0.05, when applying tests for testing differences between three or more groups.
Furthermore, what also needs to be stated is the name of the test used for post-hoc comparisons, because different tests have different uses, as well as advantages and disadvantages (10).
Authors need to make sure that all tests used in their work have met the assumptions for their use and this information needs to be provided to the readers in the sections Statistical analysis and Results. More comprehensive review on the choice of the right statistical test has been extensively elaborated in this Journal within the section Lessons in biostatistics (11).
Is P value provided for all tests done in the study?
P value needs to be stated as exact number with three decimal places (i.e. P = 0.027). The use of expressions like NS, P > 0.05, P < 0.05 and P = 0.0000 is strongly discouraged. P should be provided with capital letter and should not be italicized. P < 0.001 is the smallest P value that should be reported. There is no point to provide more than 3 decimals for P, with the exception of some studies when large samples and rare events are studied (12).
Data interpretation
Even if correct statistical test was used to analyze the data, mistakes can still occur when authors interpret their results. When interpreting the data and results, authors need to make sure to take into account the a priori stated level of significance. This means that differences may be interpreted as significant, only if P value is below the stated level of significance. Expressions like ‘borderline significant’ are strongly discouraged and will not be accepted.
Furthermore, statements like this are also discouraged:
- We have observed the difference between our study groups, although not statistically significant.
- Though not statistically significant, concentration of glucose was higher in females than in males.
- There was a trend towards higher values of marker X with increasing concentrations of marker Y. The observed association was unfortunately not statistically significant.
If statistical significance was not observed, data should not be reported and discussed as significant. Moreover, no matter how obvious, difference should not be discussed unless the authors have tested for its statistical significance. Unfortunately, this often occurs when differences between two or more measures of diagnostic accuracy (AUC, sensitivities and specificities), correlation coefficients and odds ratios are being discussed.
Correlation analysis
Interpretation of the results of correlation analysis is frequently incorrect. When interpreting the results of the correlation analysis, authors first need to explore the level of the significance of the correlation coefficient. Correlation coefficient may be interpreted only if significant. If the obtained P value is > 0.05 (or above the predetermined level of significance), correlation coefficient is not significant and should not be interpreted.
When interpreting the value of the correlation coefficient, authors should follow the generally accepted classification by Colton (1974) (5). There is no correlation between the data if r < 0.25, even if P value is very low. The use and interpretation of correlation analysis is nicely reviewed by Udovicic M et al. in Biochemia Medica (13).
Conclusions on the causal relationship
When there is an association between measured parameters, authors often tend to make conclusions on the causal relationship of their observations. This is strongly discouraged. The existence of association does not prove the causal relationship of the data.
For example, the association of higher body mass index (BMI) with increased serum C-reactive protein (CRP) levels does not prove that CRP induces the increase in BMI, nor that BMI increase induces the increase in CRP. This only means that people with higher BMI tend to have higher concentrations of CRP.
Only if the study is an experiment or clinical trial, authors are allowed to make conclusions on the causality of the data. Since most of the studies submitted to our Journal are observational (i.e. researcher only observes the differences, associations in variables of interest, without any intervention of the investigator on the study population), it is not acceptable to report any effect or induction of measured parameters. Furthermore, if the study is observational and involves monitoring of some parameters over time, it is justifiable to report the increase and decrease of monitored parameter. Otherwise, expressions like increase and decrease are not acceptable and authors are encouraged to use expressions like higher and lower, instead.
Listed below are several examples of incorrect statements which are strongly discouraged for all observational studies (which did not involve monitoring of parameters of interest over time). Each incorrect statement is followed by a suggestion for revised, correct expression.
Incorrect: Compared with the control group, ox-LDL levels were significantly increased in patients on hemodialysis (P = 0.001).
Correct: Compared with the control group, ox-LDL levels were significantly higher in patients on hemodialysis (P = 0.001).
Correct: Compared with the control group, ox-LDL levels were significantly higher in patients on hemodialysis (P = 0.001).
Incorrect: We found a significantly decreased level of GPx in blood of asthmatic children as compared to age and sex matched controls (13.61 ± 5.73 vs. 15.22 ± 6.75, respectively; P = 0.036).
Correct: We found a significantly lower level of GPx in blood of asthmatic children as compared to age and sex matched controls (13.61 ± 5.73 vs. 15.22 ± 6.75, respectively; P = 0.036).
Correct: We found a significantly lower level of GPx in blood of asthmatic children as compared to age and sex matched controls (13.61 ± 5.73 vs. 15.22 ± 6.75, respectively; P = 0.036).
Incorrect: We observed that carrying AA genotype is significantly increased in healthy controls compared to patients (OR 2.5, 95% Ci = 1.7-3.9; P = 0.012,).
Correct: We observed that frequency of AA genotype is significantly higher in healthy controls compared to patients (OR 2.5, 95% Ci = 1.7-3.9; P=0.012).
Correct: We observed that frequency of AA genotype is significantly higher in healthy controls compared to patients (OR 2.5, 95% Ci = 1.7-3.9; P=0.012).
Incorrect: Obstructive sleep apnea induced the increase in concentrations of hsCRP compared to healthy controls (P = 0.045).
Correct: Concentrations of hsCRP were higher in children with obstructive sleep apnea, compared to healthy controls (P=0.045).
Correct: Concentrations of hsCRP were higher in children with obstructive sleep apnea, compared to healthy controls (P=0.045).
Incorrect: Logistic regression identified serum copeptin (OR 3.1; 95% Ci = 1.7-12.4; P = 0.043) as an independent predictor of 1-month mortality of patients suffering from traumatic brain injury. We therefore conclude that copeptin induces mortality after traumatic brain injury.
Correct: Logistic regression identified serum copeptin (OR 3.1; 95% Ci = 1.7-12.4; P = 0.043) as an independent predictor of 1-month mortality of patients suffering from traumatic brain injury. We therefore conclude that increased serum copeptin concentrations are associated with higher risk of mortality after traumatic brain injury.
Correct: Logistic regression identified serum copeptin (OR 3.1; 95% Ci = 1.7-12.4; P = 0.043) as an independent predictor of 1-month mortality of patients suffering from traumatic brain injury. We therefore conclude that increased serum copeptin concentrations are associated with higher risk of mortality after traumatic brain injury.
Checklist
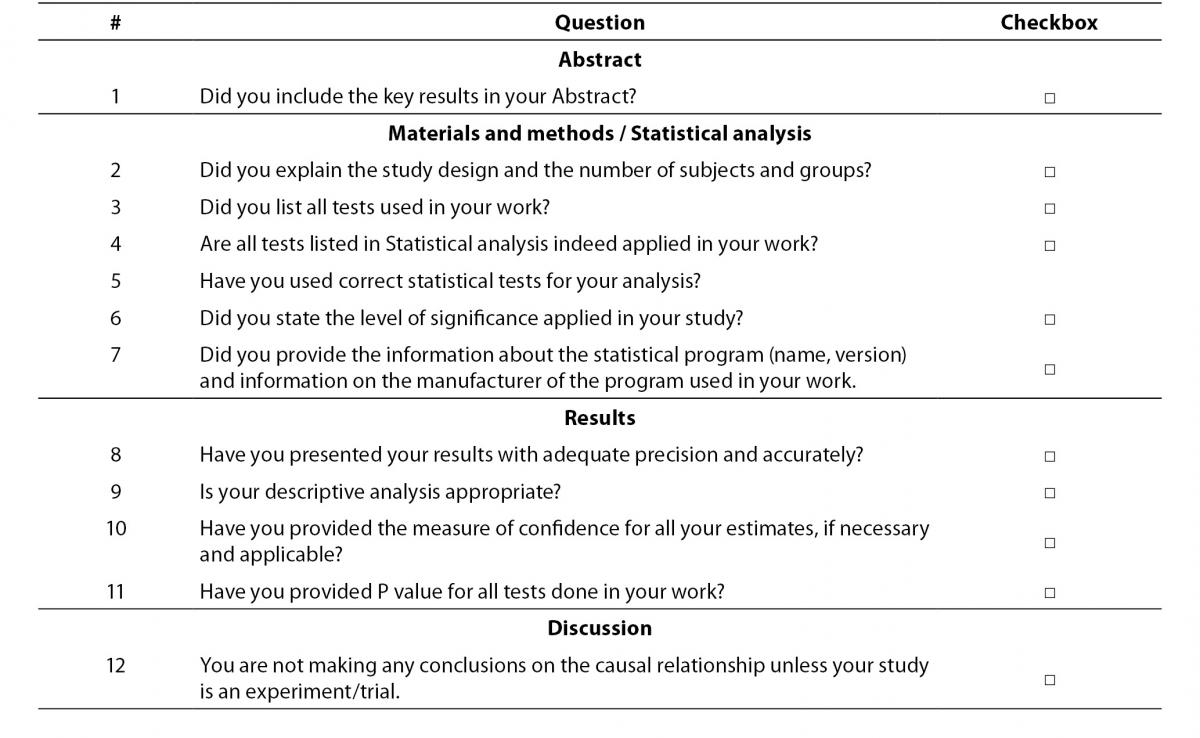
Herein we provide the short checklist for all future authors who wish to submit their articles to Biochemia Medica (Table 3). We strongly encourage authors to check the items from the checklist prior to submitting their work for potential publication in our Journal. The aim of the checklist is to remind authors to some most important issues related to their data analysis and presentation. More extensive checklist for editing and reviewing statistical and epidemiological methodology in biomedical research papers, has already been published in this Journal with the aim to assist statistical reviewers and editors as well as to authors when planning their study and preparing their manuscripts (14).
Table 3. Checklist for authors who submit their work to Biochemia Medica.
Conclusions
Authors are encouraged to browse through some older issues of this Journal for some more comprehensive coverage of some specific statistical terms and related issues. The point of this article was to provide a more general and basic guidance and alert authors to some important key factors that need to be remembered when writing an article. We invite all future authors to read this article and complete the checklist prior to submitting their work to our Journal. This will increase the quality of the submitted work and speed up the peer-review and publication process for published articles.