Introduction
Urinary tract infection (UTI) is one of the most common types of infection. It is typically diagnosed on the basis of symptoms, signs and urinalysis, and early diagnosis and treatment are very important (1). Semi-quantitative culture of a urine specimen is the gold standard for UTI diagnosis and the only method that can provide detailed information on urinary bacterial infection (2). However, urine culture is costly, the analysis takes at least 24 hours, and up to 60-80% of the results are negative (3). Therefore, faster screening methods that could cull some of the culture-negative urine samples are needed to improve the efficiency of urine sample handling.
Urinalyses with a manual dipstick or microscopic urine sediment analysis are valued as quick and inexpensive screening methods (2). These tests are often used in conjunction with or in place of a urine culture for diagnosing a UTI. However, the techniques are labor-intensive and time-consuming, and they can suffer from considerable interobserver variability (4). Recently, automated instruments capable of examining urine for cells and particles have been introduced for the analysis of unspun urine. Some use a video camera and image-based analysis to capture and sort particles based on their dimensions (5), whileothers use the principles of flow cytometry (6). Several studies have shown that flow cytometry and image analysis can be used to detect bacteriain the urine (3,5-9).
The UriSed automated urine microscopic analyzer (77 Electronica, Budapest, Hungary) is a new system that microscopically analyzes samples using image processing software and a Digital Imaging Cell Identification system (10) connected to a LabUMat automated urine chemistry analyzer (77 Electronica, Budapest, Hungary). Although several studies have evaluated the diagnostic accuracy of various analyzers in predicting urine culture positivity, there are insufficient and conflicting data on the ability of the UriSed analyzer to distinguish urine samples with and without significant bacteriuria (11,12).
Here, we assessed the diagnostic accuracy of the UriSed analyzer for predicting positive urine cultures in a routine hospital laboratory setting.
Materials and methods
Study design and subjects
For this study of diagnostic accuracy, we enrolled a total of 402 unselected consecutive patients who attended the Sevket Yilmaz Research and Education Hospital on the same day with suspected UTI in January of 2009. The decision to obtain both urinalysis and a urine culture were made by the evaluating physicians as a part of their routine practice. No attempt was made to change current physician practice.
Specimens from all age groups and both genders were included. Urine samples were sent to the laboratory from different departments,including the Departments of Medicine, Surgery, Gynecology and Pediatrics,and theIntensive Care Unit (ICU). History of UTI and clinical findings were recorded.
In most cases, patients were asked to wipe their external genitalia with wet tissues before urinating, and to collect urine samples during spontaneous urination (clean catch midstream). Specimens from the ICU patients were collected after new insertion of an indwelling Foley catheter under aseptic conditions. The urine samples were collected in disposable, sterile, neutral containers with screw lids (FiratMed; Istanbul, Turkey) and were processed within 2 h of collection.
First-morning urine samples of sufficient volume (> 10 mL) were accepted. Urinalysis was performed by a trained technician in the biochemistry laboratory. Urine culture was performed in a microbiology laboratory, and bacterial concentrations were determined by a single microbiologist.
Eighteen patients (17 female, 1 male) who were hospitalized and had been prescribed antimicrobials whose activity spectra included all microorganisms isolated from the index urine culture were excluded from the study. Data from the remaining 384 patients were evaluated.
Semi-quantitative urine culture
A calibrated 0.001 mL bacteriologic loop was used to inoculate urine onto 5% (v/v) Columbia blood agar and Eosin Methylene Blue (EMB) agar plates (Biomerieux, Marcy l’Etoile, France) within 30 min of collection. Inoculated plates were incubated aerobically at 37 °C for 18 to 24 h (13).
Bacterial concentrations were expressed as the numbers of colony forming units (CFU) per milliliter. A sample was considered culture-positive if it contained a pure culture of > 105 CFU/mL in asymptomatic cases. Under symptomatic conditions (dysuria, urgency, urinary frequency, flank pain, loin-to-groin pain, suprapubic pain, and/or urinary retention), > 104 CFU/mL was viewed as significant (14). Identification of pathogenic microorganisms was performed using the Vitek 1 automated system (Biomerieux, Marcy l’Etoile, France) according to the manufacturer’s instructions.
Urinalysis by the UriSed Automated System
The UriSed Automated Urinalysis System performs automated urine microscopy followed by automated urine chemistry analysis, using a LabUMat (77 Electronica, Budapest, Hungary). The device centrifuges the urine sample at 2000 rpm for 10 s, collects the particles from the bottom of the basin, and microscopically examines the samples under 15 fields at 400 x magnification. The UriSed machine takes photographs through a built-in microscope at several stages of processing, and evaluates the data via image processing software that is able to detect and further classify particular urine particles(15).Test strip urinalysis (LabStrip U11 Plus; Analyticon Biotechnologies AG, Lichtenfels, Germany) is carried out prior to image analysis via the LabUMat. In the present study, urinary leukocyte esterase (LE) and nitrite tests were also assessed.
Before analysis of specimens, two urine samples were analyzed for quality-control purposes (Quantscopics; Quantimetrix, California, CA). Between-run quality control was assuredby analyzing the results from QC1 and QC2. Within-run precision was determinedby analyzing specimens spiked with various concentrations of erythrocytes,leukocytes and epithelial cells, with 12–20 replicates (usually 15) performed for each sample. The precision of each measurement method was assessed by analyzing the coefficients of variation (CVs), which were calculated as percentages.
The present study was approved by the Bursa Regional Ethics Committee, and all participants or their parents (in the case of children) or next-of-kin gave written informed consent. All procedures were performed in accordance with the Second Declaration of Helsinki.
Statistical analysis
Statistical analyses were carried out using SPSS 13.0 for Windows (SPSS Inc., Chicago, IL, USA), with culture results taken as the gold standard. For analysis, samples were divided into two groups: culture negative and culture positive. The diagnostic accuracy of WBC and bacterial counts for UTI was measured by the area under the curve (AUC) for the receiver operating characteristic (ROC), and the confidence interval (Cl) was calculated (16).
Using the positive culture as the gold standard, sensitivity (SE) (true positive [TP] / [TP + false negative {FN}]), specificity (SP) (true negative [TN] / [TN + false positive {FP}]), positive and negative predictive values (PPV, NPV), accuracy (TN + TP) / (TN + TP + FN + FP), positive likelihood ratio (LR+): [SE / (1-SP)] and negative likelihood ratio (LR-): [(1-SE) / SP] were calculated (16). The Youden index [calculated as the maximum (SE + SP - 1) value] was used to estimate the best cut off points for discriminating samples in the positive and negative groups.
Results
Specimens were obtained from 262 females (68%; mean age, 48 years; age range, 2 to 91 years) and 122 males (32%; mean age, 52 years; age range, 2 to 83 years). The majority of samples (73%) were from outpatients.
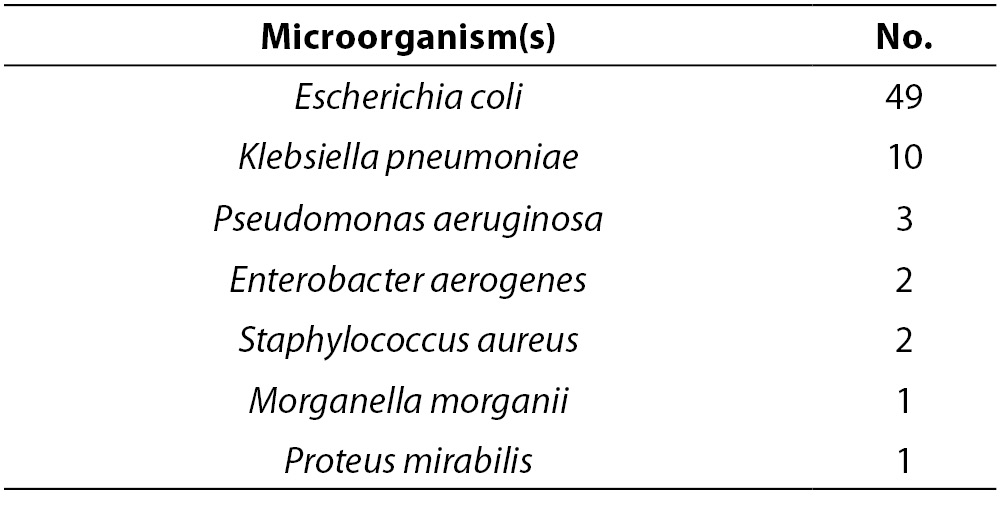
Urine samples were evaluated by semi-quantitative urine culture, and 68 (18%) of the specimens yielded positive cultures. The microorganisms isolated from these cultures are listed in Table 1. Among the isolated bacteria, Escherichia coli was the most common.
Table 1. Microorganisms isolated from 68 positive urine cultures.
A sample was designated ‘positive’ if the particle count for bacteria exceeded 44 cell/µl and the leukocyte count exceeded 14 cell/µl. These cut off values were established using the Youden index method (16), and were consistent with those found in a previous study (3).
ROC curve analyses showed that the discriminatory power for leukocytes (AUC = 0.819; 95% Cl, 0.767-0.870) was greater than that for bacteria (0.626; 95% Cl, 0.549-0.703).
Parameters of diagnostic accuracy are summarized in Table 2.
Table 2. Sensitivity, specificity, positive and negative predictive values, likelihood ratios and accuracy for prediction of urinary tract infection from urinalysis.
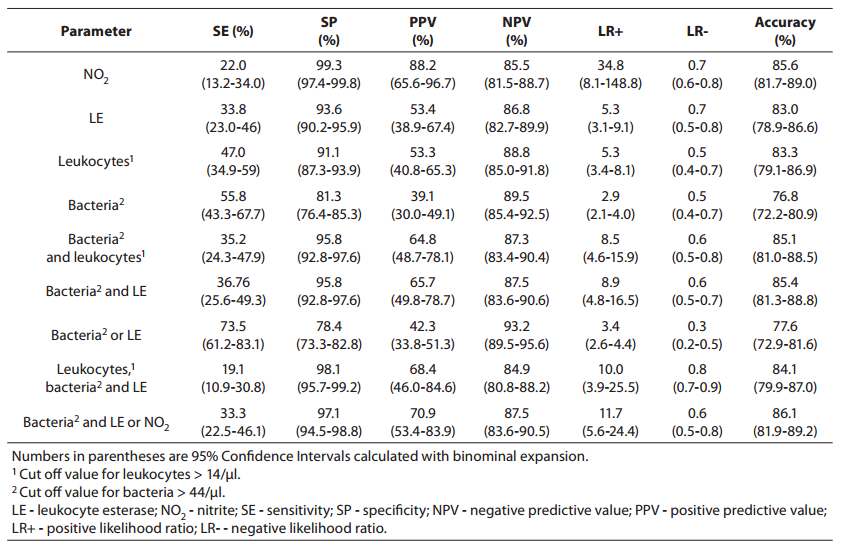
Using the bacteria count alone (> 44 cell/µl) for determining significant bacteriuria, we obtained a sensitivity of 55.8% (95% Cl, 43.8-67.7 %), a specificity of 81.3% (95% Cl, 76.4-85.0 %), a PPV of 39.1% (95% Cl, 30.0-49.1 %), and an NPV of 89.5% (95% Cl, 85.4-92.5 %). The specificity of 81.3% reflects that 30 of the culture-negative patients had findings for bacteria above the cut off value for urinalysis (16).
Using the leukocyte count (> 14 cell/µl), we obtained a specificity of 91.1% (i.e., it correctly identified 91.1% of those who did not have a positive culture finding). The PPV and NPV were 53.3% (95% Cl, 40.8-65.3 %) and 88.8% (95% Cl, 85.0-91.8 %), respectively, indicating that use of the leukocyturia parameter alone to detect culture positivity would result in a large number of false positives andsome false-negatives.
Nitrite positivity was found to be the most accurate (85.6%)test for detecting culture positivity. It also showed acceptable specificity and positive and negative predictive values. Nitrite positivity yielded the highest LR+ ratio, which is the best indicator for ruling-in diagnosis (16).
The LR-s were found to be generally inadequate for all of the studied measurements (for all parameters, > 0.3) (16).
Discussion
The present study found that 82% of urine cultures were negative, which is comparable to previous reports by other authors (3,11,12), and studies showing that the percentage of culture-negative samples is ~ 65 to 80% (6-9,17). The nitrite and LE analyses were found to have very high specificity but low sensitivities, which agrees with previous reports (11,18,19). Nitrite alone had a relatively high positive likelihood ratio (34.8), and thus might be useful for ruling in disease. However, it had a relatively poor negative likelihood ratio (0.7), suggesting that it may not be useful for ruling out disease (16). It should be noted that bacteria such as Staphylococcus saprophyticus, enterococci, and Acinetobacterspecies do not reduce nitrate to nitrite, and may therefore yield false-negative results (2). Another limitation is that the test requires a specimen of the first urine produced in the morning, as bacteria require 4 h to convert nitrate to nitrite at reliably detectable levels (2).
Consistent with other reports (11,18,19), LE alone appears to be a relatively poor test both for ruling in (pooled LR+ = 5.3) and ruling out disease (pooled LR- = 0.5). The false-positive and false-negative results that were observed for the LE values may reflect leukocytes, eosinophils, and Trichomonas spp. passing from vaginal fluid to the urine, as well as urine nitrites, hypotonic and alkaline urine, abnormal urine pH, and high bilirubin, protein, and hemoglobin values (11).
The value of microscopic examination of urine in screening for UTI is still controversial. The detection of urine culture positivity using spot bacteriuria has shown sensitivities of 52–98% (8,11,12,17,18), but it is difficult to directly compare these results because the reported sensitivities and specificities depend on the definitions used for gold standard positive and negative urines, which can vary among laboratories. For example, some authors consider a urine sample positive if it contains more than 104 CFU/mL (11,12), while others consider > 103 CFU/mL to reflect positivity (20).
Various reports have indicated that the most acceptable bacteriuria data are obtained using flow-cytometric systems (5-8,20). Differences in the results obtained from various analyzers might be attributable to different patient populations, different definitions of significant bacteriuria, variable features of urine (i.e., cellular debris may sometimes be misclassified as bacteria), different cut off values, and the fact that the instruments use different methods to detect bacteria. When evaluating bacteriuria results, users must also remember that culture detects only live bacteria, whereas the analytic systems are incapable of differentiating live bacteria from dead, or pathogenic versus nonpathogenic bacteria.
For the UriSed analyzer bacteriuria data to be useful in culling negative urine samples, it should show a high sensitivity and a high negative predictive value (16). In the present study, however, the bacteriuriadata obtained from the UriSed urinalyzer showed low sensitivity (55.8%) and a low NPV. The specificity of the UriSed bacteriuria parameter was acceptable, but the PPV (39.1%) was low. The problem with NPV and PPV is that they are dependent on the prevalence of disease in the population (16); if the prevalence decreases, the PPV will decrease and the NPV will increase. Overall, however, the relatively large number of false negatives and low sensitivity are not acceptable, since a false negative urine test will prohibit the urine from being cultured.
The presence of leukocytes in urine reflects an inflammatory response in the urinary tract. On ROC analyses performed for clinical evaluations, higher AUC values were obtained from leukocyte counts versus bacteriuria data, indicating that the discriminatory power of leukocyturia was greater than that of bacteriuria. However, the use of the leukocyturia parameter alone to detect culture positivity would result in a large number of false positives andsome false negatives. When evaluating false-positive results in female patients without infection, researchers should consider other important conditions, such as leucorrhea, fever, pregnancy, and administration of certain drugs (18,22,23).The presence of few or no leukocytes in urine is consistent with the absence of an inflammatory response in colonized (rather than infected) individuals. In addition, false-negative WBC counts might be obtained in patients with cell lysis.
We compared several combinations of parameters to determine if they could predict positive urine cultures, potentially allowing us to safely and rapidly cull negative samples. In various prior studies, the combination of bacteria, leukocytes, nitrite, and leukocyte esterase measures yielded a high specificity and high PPV, but the false-negative rate was also high (11,17,24). Thus, the issues of high NPV and low sensitivity must be considered when these four parameters are used together.
Kellogg and co-workers (25) suggested that a screening test for early detection of urine-culture-positive patients must have a 95% sensitivity and a 95% NPV. A useful laboratory test should have a sum of sensitivity and specificity > 170% (26). Thus, a laboratory test with 95% sensitivity and 95% specificity (sum = 190) should be considered an excellent test (26). In our present study, no parameter or combination thereof met these criteria.
Comparison of the data we obtained from the UriSed urinalysis system with previous reports showed that the specificity values were similar, but our sensitivity was very low. It is difficult to compare sensitivities, as the cut off values for bacteriuria and leukocyturia vary widely among studies (3,7-9,11,12,15,17-21,23). Instead of using the values suggested by the operator’s manual, further studies should be undertaken to determine acceptable figures for these parameters. Such an evaluation should be conducted prior to autoanalyzer installation.
Our study has some limitations. First, although the outpatients were asked to provide early morning urine samples, this was not verified. Furthermore, the number of enrolled patients was relatively small for the determination of a > 90 agreement rate.
In conclusion, we found that the use of the UriSed analyzer and urine strips, whether used separately or in combination, did not accuratelypredict the outcome of urine cultures.