Introduction
Gentamicin belongs to the aminoglycosides group of antibiotics which are among the oldest antibiotics available to treat serious infections caused primarily by gram-negative bacteria. When the use of aminoglycosides became more widespread, the toxic effects, ototoxicity and nephrotoxicity, became more apparent and there was a switch to other, safer, antimicrobial agents, and the use of aminoglycosides sharply declined. However, the development of multi-drug resistance among bacteria has now led to resurgent use of the aminoglycosides in the treatment of serious infections. Not only does gentamicin offer comparable low levels of resistance but it is rapid in its bactericidal activity. However due to toxicity, there is a need to monitor plasma concentrations to prevent the rare occurrence of sudden idiosyncratic deafness and nephrotoxicity with prolong therapy (1,2). Even though guidelines exist for monitoring plasma concentrations (3) a recent study reported 20% of collected samples were outside the required sampling window (6 -14 hours post dose), and 15% of doses were adjusted without monitoring and approximately half of all dose adjustments were based on inadequate information or inaccurate nomogram interpretation (4).
Serum protein abnormalities have been shown to interfere with turbidimetric assays such as vancomicin on the Beckman DxC800 general chemistry analyzer (5). Interferences have also been reported with other turbidimetric assays, C-reactive protein (6,7) phenytoin (8), and transferrin (9), as well as with nephelometric assays, IgA and IgG (10), and other non turbidimetric/nephelometric assays such as total bilirubin (11), thyroid-stimulating hormone (12), lactate dehydrogenase, uric acid and alkaline phosphatase (13), glucose and gamma-glutamyl transferase (14), HDL-cholesterol and as well as glucose interference being observed with glucose analyses on a hexokinase method but not on an oxidase method (15). From our searches no such interferences have been reported with gentamicin.
Materials and methods
Case
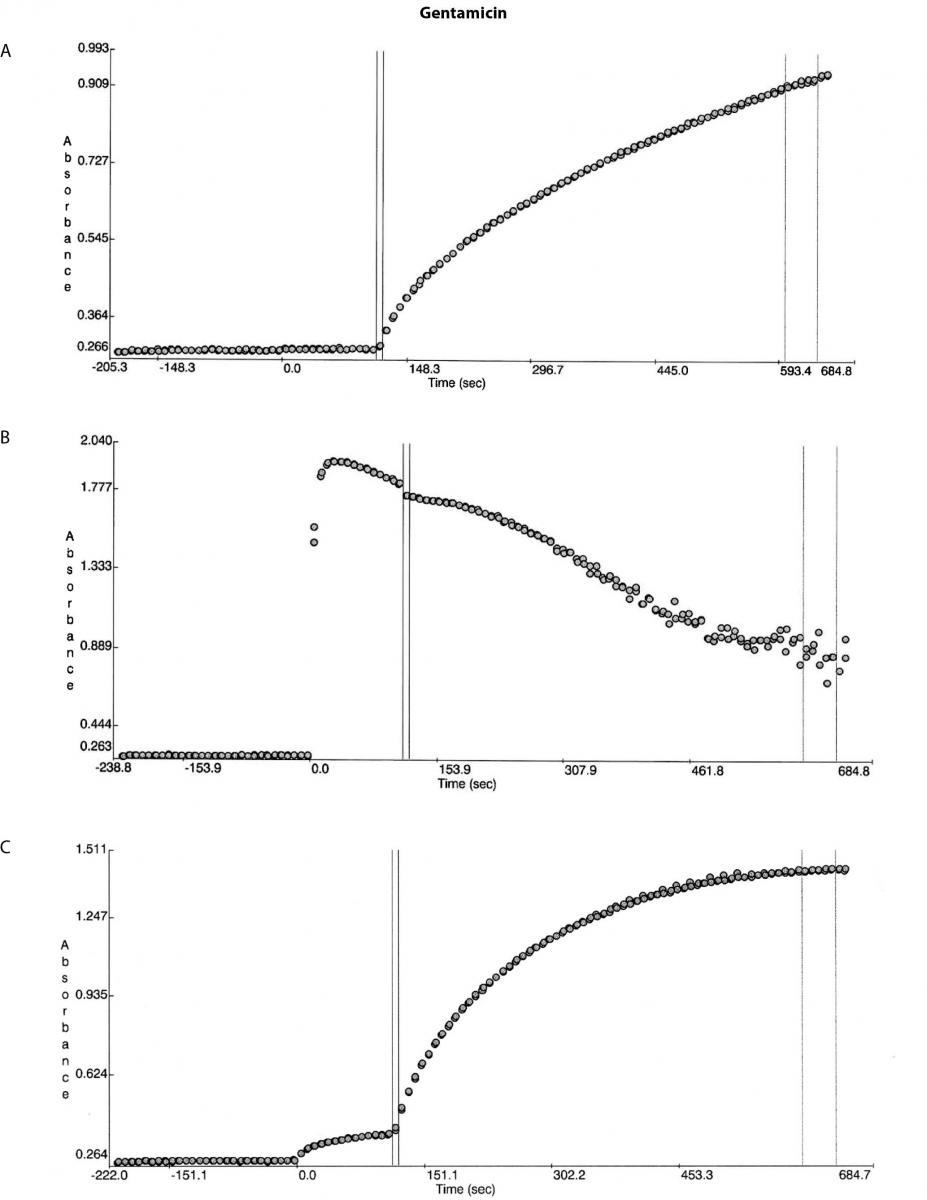
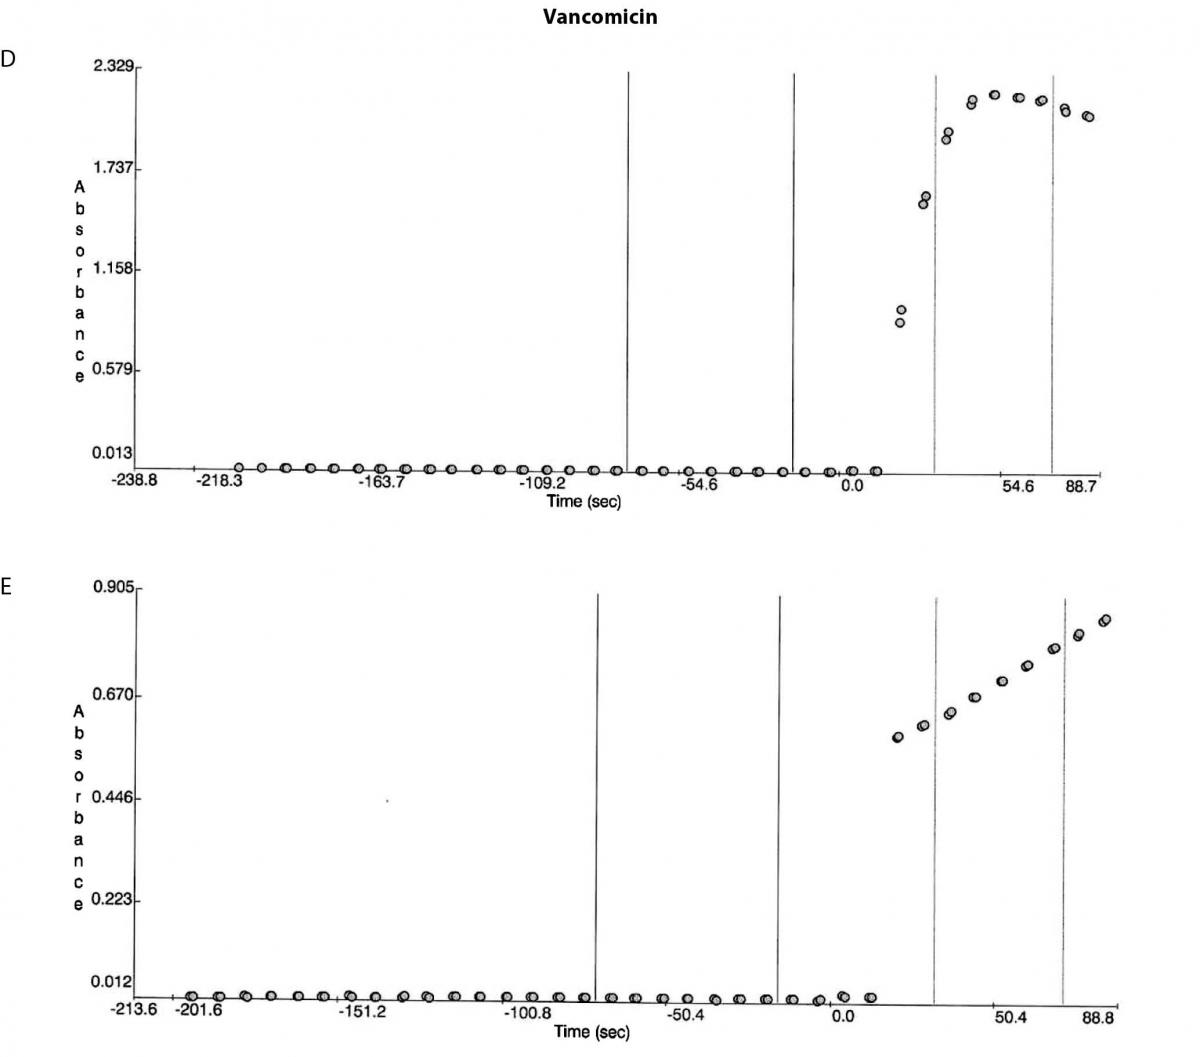
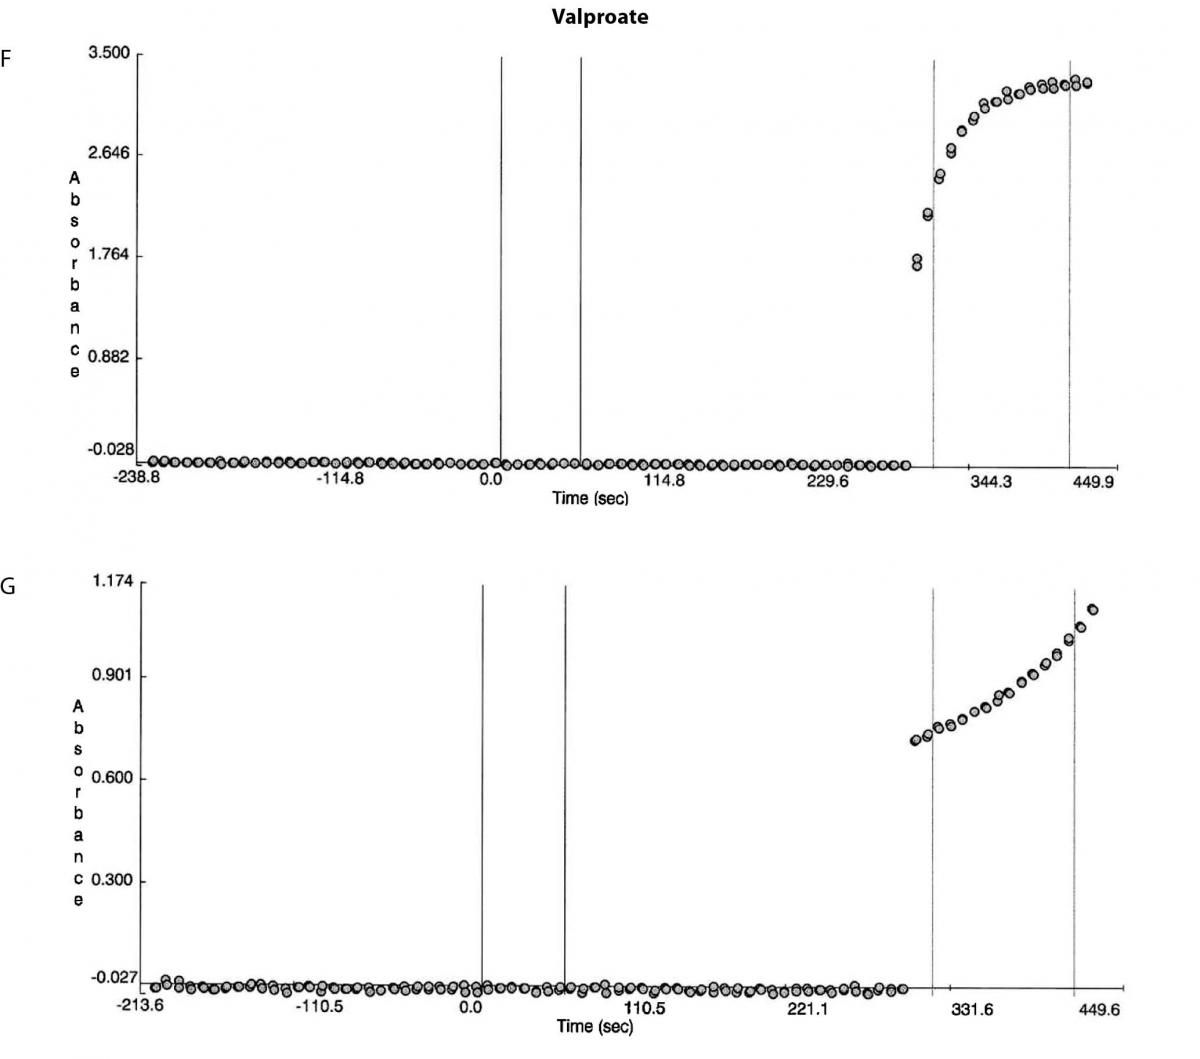
A 93 year old female with severe dementia presented with leg cellulitis and sepsis and was administered 320 mg gentamicin (Pfizer, Perth, Australia) at one of our smaller hospitals. No further gentamicin was administered during her hospital stay. On presentation the patient’s sample was analysed on a Beckman DxC600 general chemistry analyser (Beckman Coulter, Brea, CA, USA) as per Beckman Coulter recommendations and the results were: creatinine 177 µmol/L (reference range (RR) 46-108), urea 12.0 mmol/L (RR 2.9-8.2), total protein 63 g/L (RR 60-83), albumin 22 g/L (RR 35-50), and globulins 41 g/L (RR 25-45). A blood sample was collected ~40 hours post gentamicin administration and the laboratory could not obtain a result due to persistent high blank absorbance errors on the Beckman DxC600 general chemistry analyzer (Beckman Coulter, Brea, CA, USA). The sample was diluted with normal saline with ratios starting from 1/3 and going as high as 1/20. The sample was then referred to our laboratory and dilutions were repeated on a Beckman DxC800 general chemistry analyzer using the exact same method. The absorbance error could not be eliminated to obtain a result as shown by the absorbance curves in Figure 1.
Figure 1. Reaction absorbance curves for 1. Gentamicin: A- normal sample, B -case study neat sample, C-case study 1/20 diluted sample; 2. Vancomicin: D- normal sample, E- case study neat sample; 3. Valproate: F- normal sample, G- case study neat sample.
A second sample was then collected at ~50 hours post gentamicin administration and this was dispatched for analysis on a Roche Cobas system (Roche Diagnostics, Mannheim, Germany) and the result was 3.3 mg/L. No further gentamicin was administered. Review of the absorbance curves suggested an interference related problem. Although the total protein level did not suggest presence of paraproteins the globulins level was high enough not to rule out the presence of paraproteins. The sample was then diluted off board with the reagent A (reaction buffer) in the ratio used in the method and no precipitation was observed. Unfortunately by this stage due to limited volume no further tests could be conducted.
A third sample was received at ~107 hours post gentamicin administration and the gentamicin result on the Roche Cobas method was 1.2 mg/L. The remaining portion of this sample was analysed for all the turbidimetric assays utilised on the Beckman DxC800: C-RP, carbamazepine, digoxin, haptoglobin, phenytoin, transferrin, tobramycin, theophylline, valproate, vancomicin, to see if any of these would exhibit any limitations. Like the gentamicin method all these methods are particle enhanced turbidimetric inhibition immunoassay methods. Only vancomicin and valproate showed high blank absorbance readings. Additionally the sample was analysed for immunoglobulins (rheumatoid factor, IgA, IgG and IgM) by nephelometry on a BNTM II System (Siemens Diagnostic, Deerfield, IL, USA) as per manufacturer recommendations.
To determine if a suitable precipitation method could be implemented to provide more rapid results the Beckman calibrator sets for each of the three assays were precipitated to ensure accuracy is maintained post recovery from these known concentrations. We then precipitated 10 patient samples routinely requested independently for gentamicin, vancomicin and valproate were selected covering the broadest possible concentration range that is encountered for these analytes. The patient samples were precipitated by both 100% ethanol and polyethylene glycol (PEG), 24 g/100 mL (Fluka#812160, polyethylene glycol 6000, Sigma Aldrich) separately. Both of these reagents are commonly available in most laboratories. Based on the chemical structure of gentamicin (made up of amino groups attached to glycosides), and vancomicin (a tricyclic glycopeptide made up of glycans covalently attached to the side chains of the amino acid residues) it was possible PEG would not be suitable as it could precipitate these antibiotics, hence ethanol was considered as a milder alternative. The samples were processed in a single batch for each of the three analytes. Samples were mixed with equal volumes of the ethanol or PEG solution (0.25 mL : 0.25 mL), vortex mixed, than centrifuged (10 min, 3000 x g ), and the supernatant removed and analysed. For each sample the reaction curve was checked that it was normal to ensure there was no paraprotein interference.
Statistical analysis was performed using the Microsoft Excel (Microsoft Corporation, Redmond, WA, USA) and Analyse-It statistical add-on for Microsoft Excel (Analyse-It Software, Leeds, UK) for the Passing Bablok regression analysis. Recovery was calculated by subtracting the neat sample result from the post precipitation result, and the difference was then divided by the neat result and multiplied by 100% to provide the recovery percentage.
Results
Besides the gentamicin only vancomicin and valproate were affected as shown from the absorbance plots, Figure 1. The patient medical record indicated the patient was not on vancomicin or valproate. Comparing the reaction curve with the normal sample reaction curve it was clear the precipitation in the gentamicin assay was occurring upon addition of the reactive reagents (reagent B and C). The vancomicin and valproate plots equally showed the precipitation was observed upon addition of the reactive reagents (vancomicin has reagent B and C and valproate only has reagent C) (Figure 1E and G).
The immunoglobulin analysis showed the following results: rheumatoid factor < 20 IU/mL (RR < 20); IgG 2.39 g/L (RR 7.0-16.0); IgA 2.56 g/L (RR 1.0-4.0); and IgM 18.9 g/L (RR 0.4-2.3). The results confirmed the Sia test findings that the absorbance error was induced by the paraprotein (IgM) precipitation (16).
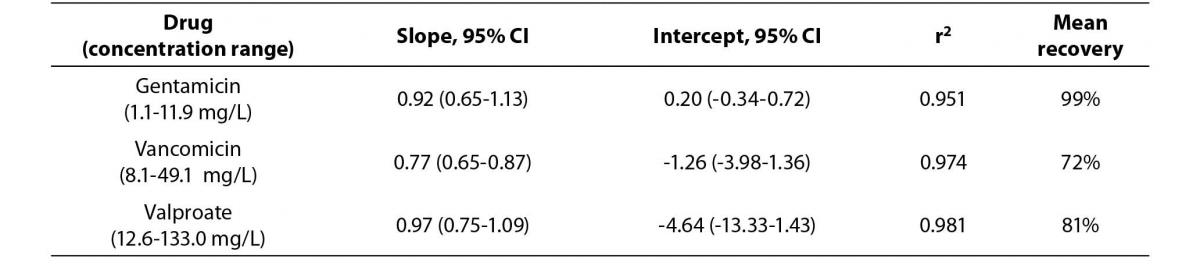
The Passing Bablok regression correlation results, concentration ranges and recovery data is shown in Table 1. The PEG precipitation produced unsuitable recoveries (mean recovery of <30%) for the three analytes. Using the internal quality control performance data (two quality control levels per each assay) the mean CVs at two standard deviations for each of the assays were: a) gentamicin 15.2%, b) vancomicin 12.6% and c) valproate 17.8%. Hence, the ideal recovery for each assay should have been: a) gentamicin 84.8-115.2%, b) vancomicin 87.4-112.6% and c) valproate 82.3-117.8%.
Table 1a. The Passing Bablok regression analysis of concentration ranges and recovery results for the Beckman calibrators treated by 100% ethanol precipitation versus stated concentrations.
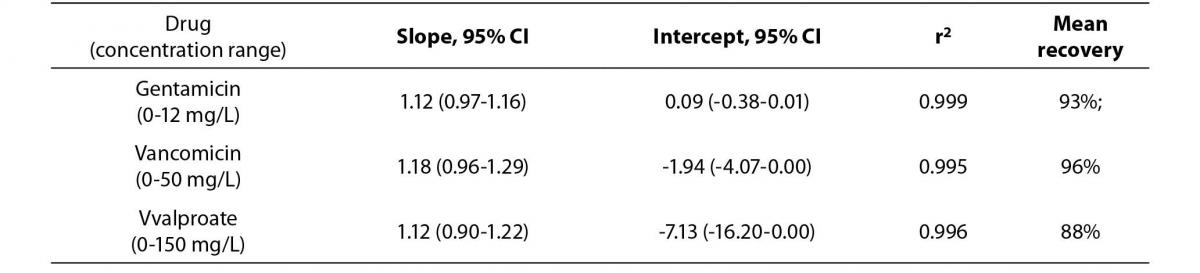
Table 1b. Comparison of drug concentrations (Passing Bablok regression analysis) measured in native patient samples and samples treated by 100% ethanol precipitation, N = 10.
Discussion
From our searches, no interference has ever been reported with gentamicin or valproate turbidimetric assays by a paraprotein. Availability of absorbance curves is a powerful tool to highlighting potential assay problems. What the absorbance curves indicated was the precipitation/turbidity was occurring in the latter part of the reaction process, the non-blanking phase, upon addition of the reactive reagents hence for the high absorbance errors. As King et al. also highlight, the reverse would occur if the precipitation/turbidity is occurring in the blanking stage, and would lead to low absorbance errors, low results. This has been reported with vancomicin by previous publications (5,17,18).
Closer scrutiny of the proteins results, globulins specifically on presentation along with the age of the patient provided a trigger for further investigation, potential presence of a paraprotein. Although IgG is the most common paraprotein (~59-70%), followed by IgM (~17%) and IgA (~11-17%) (19,20). These paraprotein producing disorders increase with age rising from 3.2% in people < 50 years of age to 5.3% in people > 70 years of age (19), 4.5% in the population in the 45-75 years of age (20). Hence the reported paraprotein interference problems are in older patients as is the case here and from review of literature IgM is most frequently reported to be the cause of interference by turbidity or precipitation. This in turn was the reason we initiated testing of all the turbidimetric assays for potential interference.
The Beckman method inserts state gentamicin, vancomicin and valproate were tested with IgM concentration up to 5 g/L without effect. In our experience the IgM concentration level is not the sole determinant for precipitation and subsequent interference. Precipitation occurs as a result of physicochemical conditions (pH, ionic strength, presence of surfactants and other chemicals in the reagents) being in the right balance, where the pH and the isoelectric point being the same and the protein charges being neutralised. This balance or uniqueness to achieve precipitation can be due to the IgM type (lambda or kappa), assay reagents or they can be influenced by other compounds like heparin (14). Ideally manufacturers should test for IgM interference with much higher concentration levels e.g. > 15 g/L, specifically with turbidimetric assays in order to better challenge the method.
Review of the Beckman method inserts of the tested turbidimetric assays does not provide ability to try and extrapolate as to why only three of the assays exhibited interference. The inserts do not contain data on the reaction buffer used (reagent A), its type or the pH and only minimal data, antibody type only on the reactive reagent(s) (reagent B or C, or B and C) being used. It is assumed the pH of the reactive reagents in these assays was sufficient to achieve the appropriate pI and cause the precipitation. The Roche gentamicin method showed no interference and this was most likely due to the analytical method difference, fluorescence polarization type rather than turbidimetric as is the Beckman method.
The available option for laboratories in obtaining an accurately representative result is predominantly to analyse samples on an alternative system/method which is not always easily accessible. Precipitation of proteins along with the interfering protein while retaining the analyte of interest in the supernatant is an alternative option. Precipitation can depend on the analyte chemical composition, and choice of precipitant and its availability. In general precipitation is most successful with inorganic compounds e.g. digoxin (21). With gentamicin and vancomicin containing amino acids ethanol was shown to be a suitable precipitant to obtain desirable recoveries with the three analytes affected in this case. The use of filtration methods is another option but they are only readily available in a few large laboratories.
Incidences or encounters like this can be a trigger to identifying the presence of unidentified pathological abnormalities and there is a need to immediately communicate to clinical staff for best patient care as was done in this case. A limitation of this study was that due to insufficient patient samples the type of IgM was not determined and neither was precipitation performed for the gentamicin to compare results to the Roche system. A second limitation was the small number (10 patient samples) tested without paraprotein interference, and the larger number of samples could also lead to improvement in the recovery.
Not just gentamicin but vancomicin and valproate are also associated with potential toxicity and the plasma levels need to be monitored. Being able to measure analytes’ concentrations and provide results both timely and accurately is the key to the existence of pathology. Having options or tools to overcome adversity, namely interferences, in house goes a long way to ensuring laboratory services are prompt and subsequent patient care decisions are optimised. When interference is detected with one analyte it is always valuable to run such sample on assays using same analytical techniques as the minimum, specifically for immunoassay based techniques.
In summary, the findings from this case showed for the first time IgM interference with gentamicin, valproate and vancomicin where the interference led to high absorbance which has never been reported with these analytes. Equally, it was shown ethanol can be used to precipitate proteins and produce acceptable recovery results. This allows all laboratories to use this technique to overcome such interferences.