Introduction
Hemolysis is the most common preanalytical source of error in clinical laboratories and responsible for nearly 60% of rejected samples (1,2). It may occur both in vivo or in vitro. The ratio of in vivo hemolysis is only 3.2% of all the hemolyzed specimens (3). In vitro hemolysis occurs more often and it is caused by improper sample drawing, handling or centrifugation. Especially hardly collected samples, or stored and/or transported, have increased risks for hemolysis.
Most of the hemolyzed samples are being rejected on pre-analysis stage according to the visual detection of serum interferences, even if the requested tests may not be interfered with hemolysis. Besides, according to the reports, visual assessment of sample hemolysis showed little agreement with the actual concentration of hemoglobin interferent (4-7).
Conversely, even if the hemolysis is not visible, there is also a discharge of the cell constituents into serum or plasma (8). So invisible hemolysis is an important cause of false results and has to be detected before the investigation procedure. Increased number of biochemical tests, number of samples and increased automation obligated laboratory staff to study harder, give results faster, so pre-analytical determination of hemolyzed sample and determination of interfered analytes before analysis became more important.
Since the knowledge of possible effects is important for correct interpretation of the results, the aim of the present work was to evaluate the effects of hemolysis interferences in different levels on routine commonly used biochemistry tests. Results of this study may help to prevent unnecessary rejections of samples.
Materials and methods
The venous blood samples, collected from 16 healthy volunteers, were taken into 5 different heparinized tubes (Vacuette ®, Greiner Labortechnik, Germany) to study the effect of in vitro hemolysis. Four samples were drawn through the needles of 5 mL syringe (1.5 inch, 21 gauge) speedily for 2, 4, 6 and 8 times respectively to lyze the cells by mechanical trauma to obtain slightly, mildly, moderately and severely hemolyzed samples. They were all centrifuged at 1000 x g for 15 minutes. This method of cell lysis was chosen because blood transferring into a tube by pushing forcely down on the syringe plunger is analogous to the mechanical disruption of erythrocytes that frequently occurs during blood collection. In this method there is no standardization way of the force applied while transferring the blood by syringe. Besides every patients’ fragility of red blood cell is different, so free Hb concentrations of all samples were not correlated with the force.
After measuring free Hb concentrations of the hemolyzed samples, the samples were grouped according to their free Hb concentrations. The exclusion criteria of a hemolyzed sample was the concentration of its free Hb concentration discordant with the degree of hemolysis determined for each group, so the number of samples were not equal at each group.
Free Hb of the samples were measured spectrophotometrically (Shimadzu Corporation; Kyoto, Japan) with Na2CO3 solution (10 mg/100 mL) as a reagent (9). Absorbances were measured at 415, 450 and 700 nm for all hemolyzed and diluted plasma.
Total plasma hemoglobin was calculated according to the formula:
Hb = 154.7 × (A425) – 130.7 × (A450) – 123.9 × (A700) (9).
(Reference ranges: 0-0.1 g/L for plasma free Hb).
Specimens were categorized according to the Hb concentrations into 5 groups:
- Group I (0-0.1 g/L), nonhemolyzed (N = 15);
- Group II (0.10-0.50 g/L) slightly hemolyzed (N = 12);
- Group III (0.51-1.00 g/L) mildly hemolyzed (N = 10);
- Group IV (1.01-2.50 g/L) moderately hemolyzed) (N = 15);
- Group V (2.51-4.5 g/L) severely hemolyzed (N = 12).
The results were analyzed to determine if slight, mild, moderate or severe hemolysis had a significant impact on the analyte concentrations.
All analytes were measured with Olympus analyzer with original reagents (Olympus AU2700 system reagent, Olympus Diagnostica GmbH, Lismeehan, O’Callaghan’s Mills, Co. Clare, Ireland).
Plasma concentrations of albumin, alkaline phosphatase (ALP), alanine aminotransferase (ALT), α-Amylase, aspartate aminotransferase (AST), total bilirubin, calcium, sodium, potassium, chloride, total cholesterol (TC), creatine kinase (CK), creatinine, gamma glutamyltransferase (GGT), glucose, high density lipoprotein cholesterol (HDL-C), iron (Fe), lactate dehydrogenase (LD), magnesium, inorganic phosphate, total protein, triglyceride (TG), unsaturated iron binding capacity (UIBC), urea, uric acid were analyzed in all groups.
The effects of the hemolysis were evaluated according to the total allowable error recommendations of Clinical Laboratory Improvement Amendments (CLIA’88) (10) (Table 1). CLIA’ 88 regulations have established fixed limits for assessing method and laboratory performance for specific regulated analytes. In practice, the total allowable error for a given analytical method must be less than the respective CLIA fixed limits for the analyte in question.
Statistical analysis
To compare the concentrations of the hemolyzed samples with nonhemolyzed samples, bias percentage was calculated by the formula:
[(CX – C1)/ C1)] x 100.
C1: concentration of nonhemolyzed sample,
CX: concentration of hemolyzed sample.
All analyses were performed using Statistical Package for Social Sciences statistical package (SPSS, version 15.0 for Windows XP). Wilcoxon signed-rank test analysis was used; P values < 0.05 were considered statistically significant.
Results
As a result of the mechanical trauma, the median free Hb concentrations for groups I, II, III, IV and V were measured as 0.02, 0.27, 0.75, 1.27 and 3.34 g/L, respectively. At free hemoglobin concentration 0.5 g/L, hemolysis was visible by the red color of the plasma.The results of the investigations were all presented in Table 1 and shown in Figure 1. Lactate dehydrogenase appeared to be most sensitive to hemolysis; the increase of č 1000 U of lactate dehydrogenase per liter resulted in a 4.5-fold higher enzyme activity at 4.5 g of hemoglobin per liter of plasma than at 0.27 g/L. A considerable increase of 30 U/L in aspartate aminotransferase activity was a 2.5 fold increase in this enzyme’s activity in severely hemolyzed plasma (hemoglobin < 4.5 g/L).
In electrolytes, potassium values were most affected, in direct proportion to the increased plasma free hemoglobin concentration, the average increase in potassium concentration being 1.48 mmol/L for hemoglobin concentrations up to 4.5 g/L, or about 1.4 fold (Figure 1).
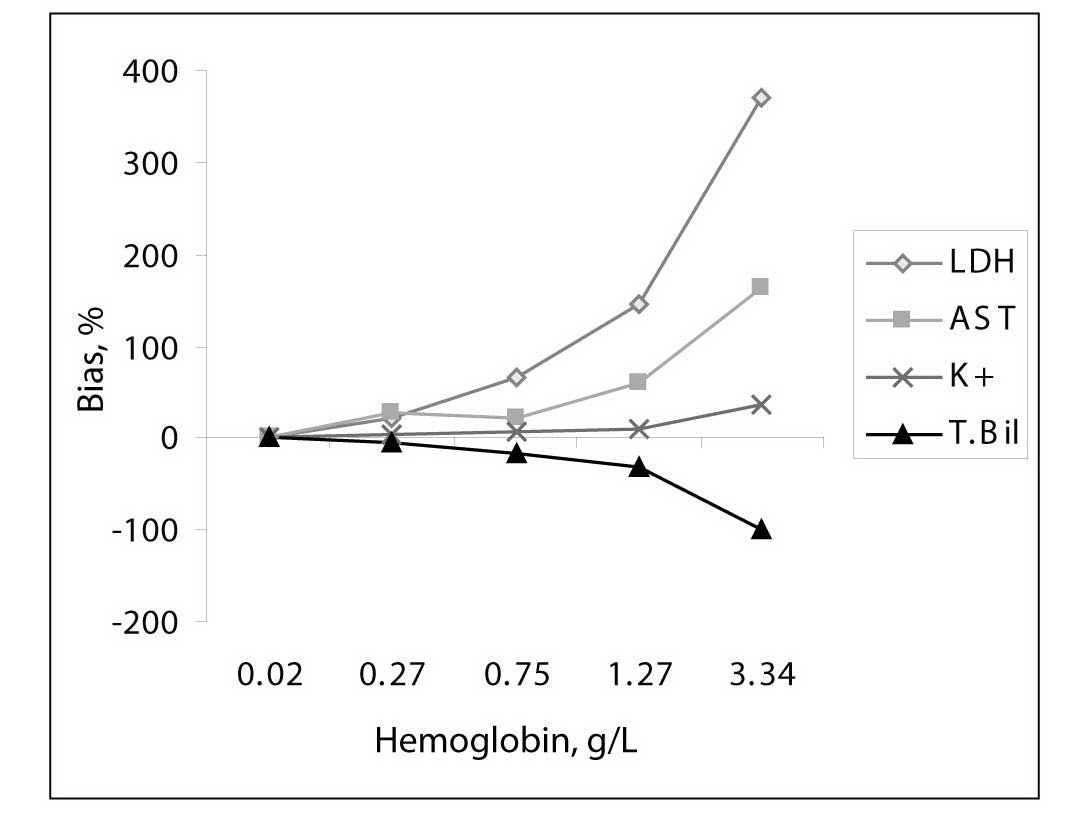
Figure 1. Interferogram for hemoglobin and measured parameters: LD, AST, potassium and total bilirubin.
Table 1 Methods, median values of the analytes and free hemoglobin concentrations for each group, % bias of analyte concentrations in comparison to the nonhemolyzed group, and ± acceptable limits of CLIA’ 88, ± desirable bias. Results with higher than CLIA limits and statistically significant differences are marked in bold.
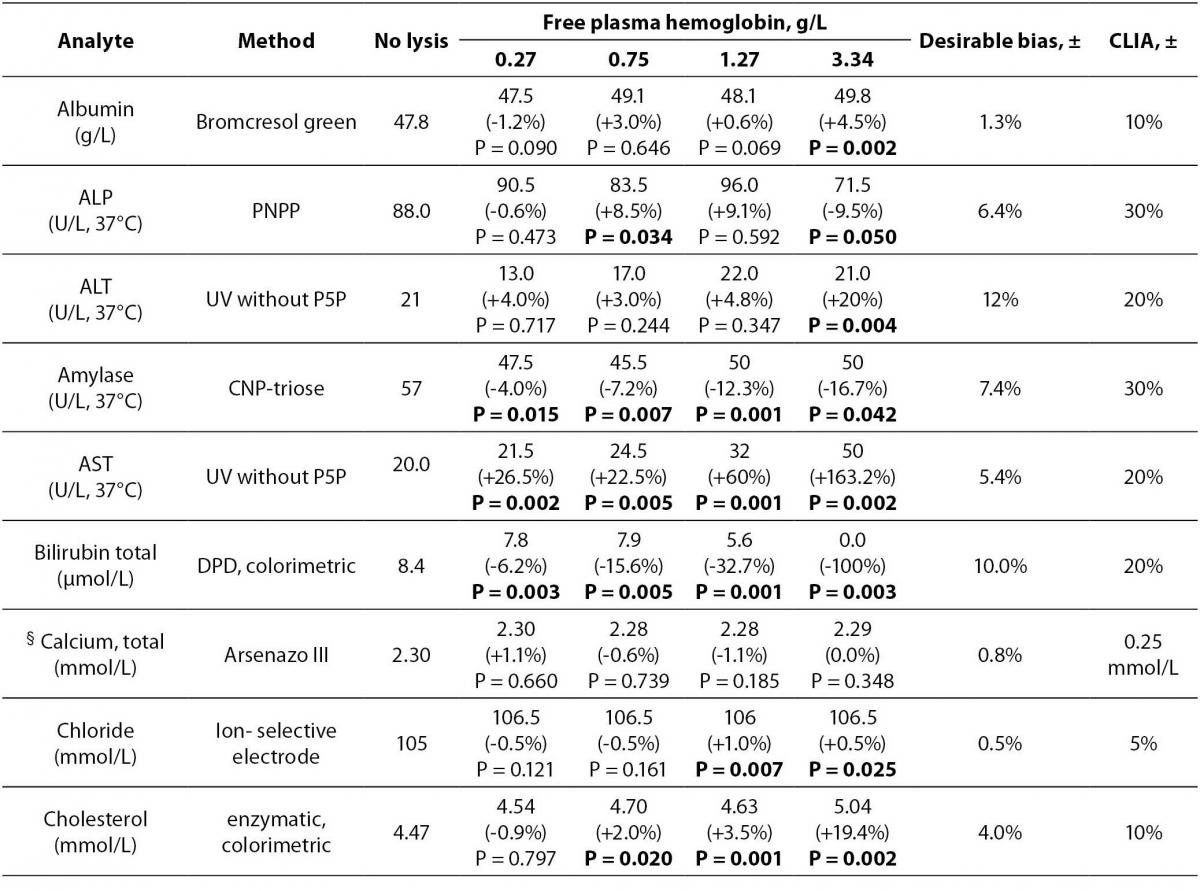
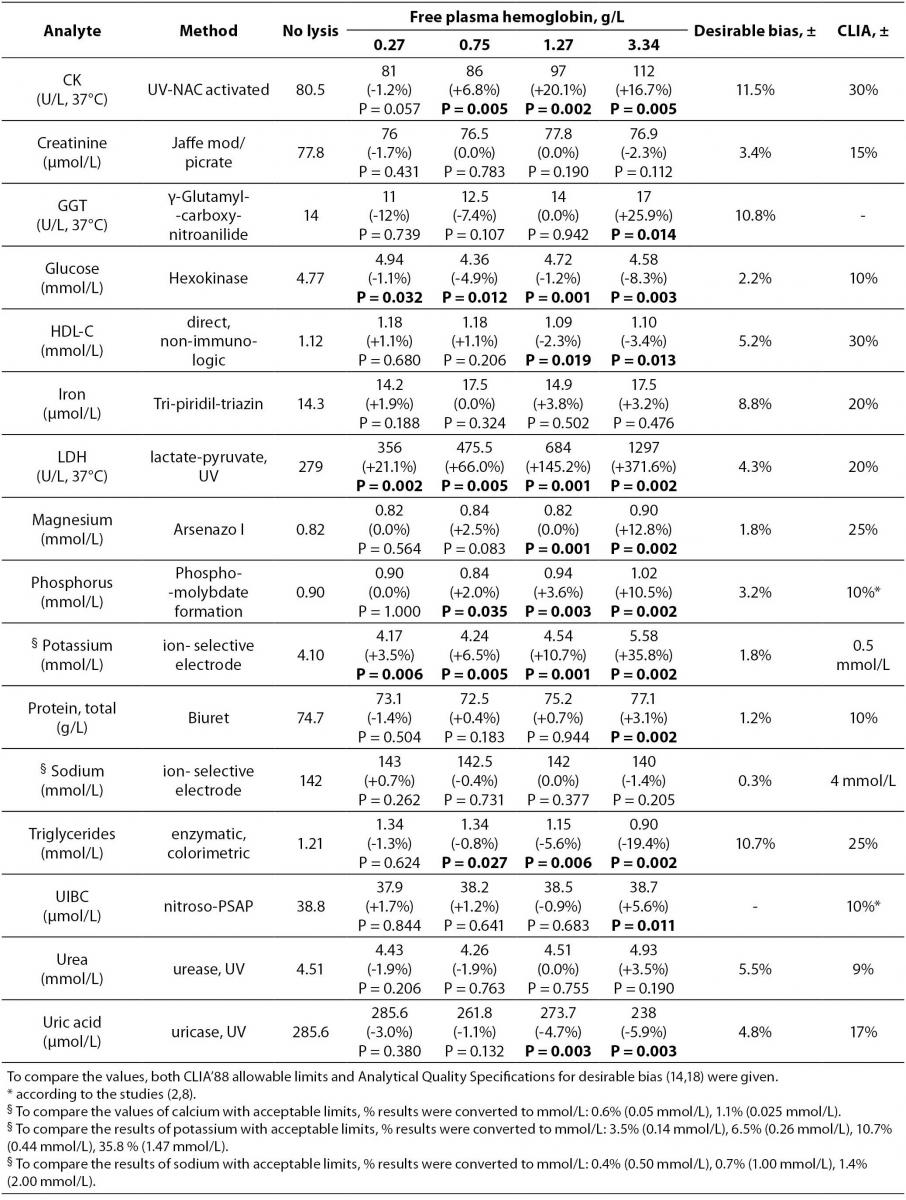
Table 1 summarizes the influence of hemolysis on routine biochemistry testing. Differences are given as median values and percentage relative bias from the baseline specimens (no lysis). As expected, LD, AST and potassium values showed significant increases approximately linearly dependent on the free Hb concentrations in hemolyzed plasma. There was a decrease (100%) in total bilirubin concentration (Figure 1).
Values of inorganic phosphorus were significantly increased linearly with the increased free hemoglobin concentrations comparing with the baseline specimens. Clinically meaningful (approximately 1.2 fold) increases in enzyme activities were observed for GGT and ALT at 4.5 g of hemoglobin per liter of plasma.
Of the analytes evaluated, the bias values recorded for albumin, alkaline phosphatase, amylase, calcium, chloride, HDL-cholesterol, creatine kinase, creatinine, glucose, iron, magnesium, sodium, total protein, triglycerides, unsaturated iron binding capacity, urea and uric acid were lower than the CLIA allowable limits even in specimens containing up to 4.5 g/L of plasma hemoglobin although for some analytes variations were statistically significant (P < 0.05) (Table 1).
Although there was no given acceptable limit for GGT in CLIA’ 88 considerations, we assumed the limit as 20% like most of the other enzymes. For the unsaturated iron binding capacity the evaluation was done according to some studies which was determined as ±10% (11,12).
Discussion
Analytic hemolysis interference occurs when the constituents of the plasma are at lower concentrations than the constituents in erithrocytes. The release of erythrocytic constituents can result in increased values for serum. Dilution is another possible effect especially for gross hemolysis, and may result in decreased values. While Hb absorbance peaks occur at č417, 540, and 575 nm and at 415 nm (Soret wave) absorbs light very strongly, therefore at these wavelengths, spectrophotometric interference occurs due to an increase in the optical absorbance or a change in the blank value (8,11-13).
Cell contents at higher concentrations of potassium, phosphate, AST and LD enter the surrounding plasma when lysis of erythrocytes occurs (8,14). As expected in the current study AST, LD, and potassium values showed clinically meaningful increases like previous investigations (8,11-17,19). So we can say that even if macroscopically invisible hemolysis occurs, AST and LD measurements may contribute to high values.
Free hemoglobin with its pseudo-peroxidase activity interferes in the bilirubin procedure by inhibiting the diazonium color formation. In our study, we found statistically low values for all groups as in literature (11) and biochemical testing has to be done for this assay with a new sample at hemoglobin concentrations higher than 1 g/L.
For cholesterol, increase in concentration was significant at 2.5 g/L of Hb levels. According to a study, the interference may result from Hb decomposition of hydrogen peroxide. This effect can be compensated for by using an appropriate sample blank (15). For HDL-C, the interference was not clinically significant up to 10 g/L of hemoglobin concentration with the same assay method (20).
Although Hb is the major source of iron, hemolysis has a very little effect on the serum iron assay which may be caused by spectral overlap and by a chemical reaction between hemolysate and reaction components like ALP, GGT, amylase and iron assays (11,12,21).
We found a slight decrease in glucose and uric acid. This effect may become from a premature decomposition of hydrogen peroxide by Hb (15). Dilutional effect caused by the leakage of intracellular components into the surrounding fluid especially in severe hemolysis may cause lower values for glucose, sodium and calcium (14,19). In this study no lysate or any other solution was added in specimens which may also has a dilutional effect on the analysis.
Although CK is not a constituent of erythrocytes, intracellular adenylate kinase has been attributed to the interference in the CK assay (14,19). Correction can be done by adding inhibitors such as adenosine monophosphate and diadenosine pentaphosphate, or by substracting the activity measured in the absence of creatine phosphate (21).
Nowadays serum hemolysis index is a popular solution for interference detection preanalytically. Manufacturers give the list of test-specific serum indices for hemolysis, lipemia and bilirubin interferences. This can help laboratory staff to be aware of interference, study or reject the sample, and add comments to the results. But the standardization problem of the various analytical systems and different decision thresholds for various serum indices requires more effort (22).
Conclusion
We conclude that hemolysis affects plasma concentration of a whole range of biochemical parameters, whereas the most prominent effect of hemolysis is observed for AST, LD, potassium and total bilirubin. For other analytes; albumin, ALP, amylase, chloride, CK, HDL-cholesterol, glucose, magnesium, total protein, triglycerides, UIBC and uric acid, differences were statistically significant, but remained within the CLIA limits. We therefore recommend routine free Hb level determination in serum or plasma, or any other automated detection of the degree of hemolysis. Only for those analyses which are affected by the estimated degree of hemolysis, new samples have to be requested. Although time consuming, this procedure is highly useful, since it may help to avoid unnecessary rerun the samples and reduce the costs.