Introduction
It is well documented that routine laboratory work is not error free and efforts have been made to improve whole laboratory testing cycle and reduce errors (1). Although the analytical phase is the least prone to errors, it still has room for improvement (2). For that purpose many guidelines, protocols and specifications for validation of analytical systems are available. They all are quite similar, but some discrepancies exist usually in acceptance criteria depending on source (3-5).
Quality parameters, inaccuracy and imprecision are basic parameters of methods performance validation as measure of systematic and random error. Those parameters are presented by coefficient of variation (CV) and bias, but also can be used for calculation of total error (TE) (6). Combining effects of systemic and random error in form of total error makes validation results of complete analytical process more evident.
The aim of our study was to validate methods performance of biochemistry analyzer Cobas 6000 analyzer series module c501 in context of our operating conditions.
Materials and methods
Analyzer and methods description
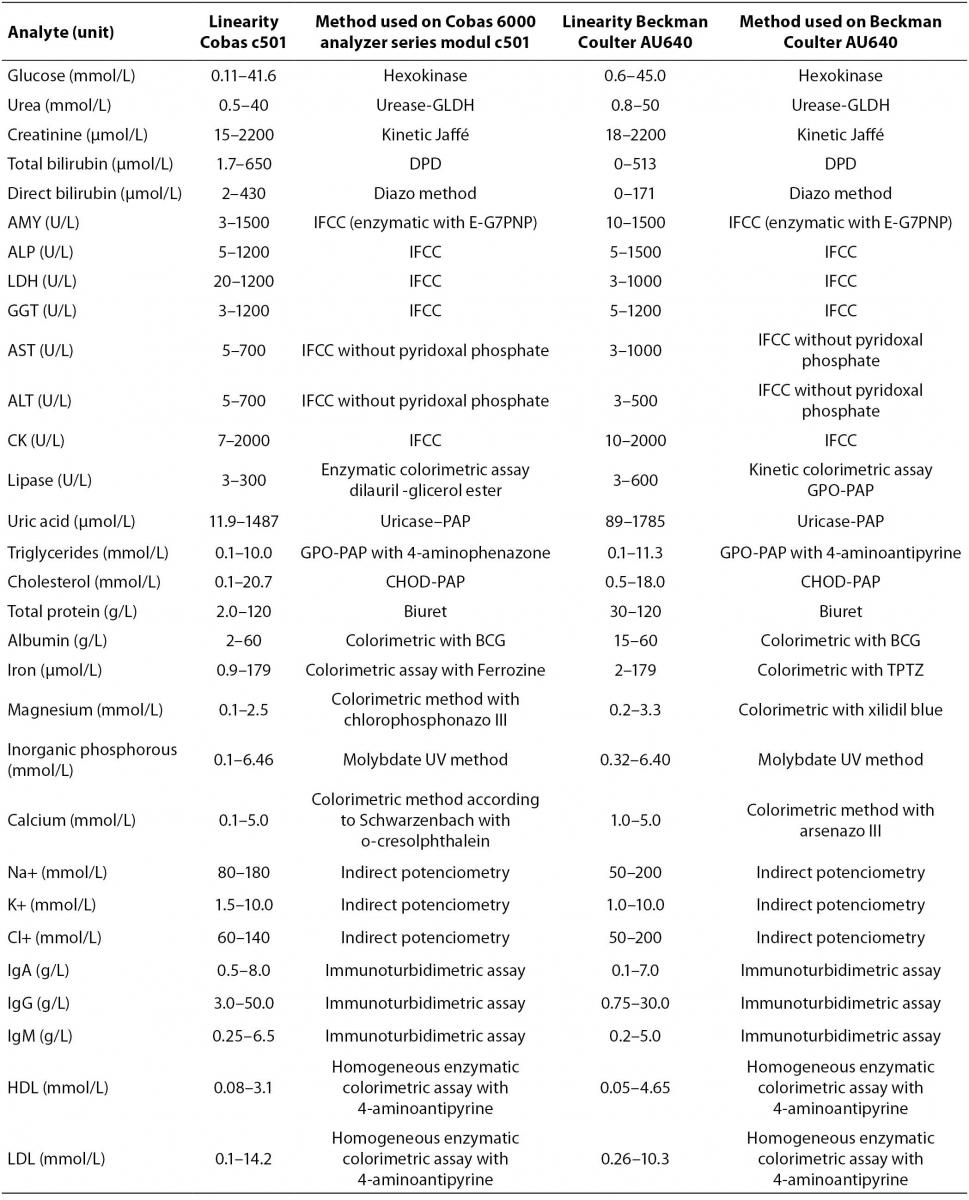
Cobas 6000 analyzer series is composed of several units (modules) that can be combined in seven different analytical systems with only one load point. Various analyzer compositions are completely adjusted to user’s needs for clinical chemistry and immunochemistry analyses with high throughput capacity (7). We validated clinical chemistry analytical unit c501 for photometric and ion-selective electrode (ISE) measurement. For validation of analyzer in routine laboratory work we tested analytes representing metabolites (glucose, urea, creatinine, total and direct bilirubin, uric acid, triglycerides, total cholesterol, HDL (high-denstiy lipoprotein) and LDL (low-denstiy lipoprotein) cholesterol), enzymes (amylase, alkaline phosphatase (AP), alanine aminotransferase (ALT), aspartate aminotransferase (AST), gamma-glutamyltransferase (GGT), creatin kinase (CK), lactate dehydrogenase (LDH) and lypase), electrolytes (sodium, potassium, chloride, magnesium, inorganic phosphorus and calcium), proteins (total protein, albumin, immunoglobulins (Ig) G, A and M) and trace elements (iron).The principle of each assay is listed in table 1. Reagents are ready to use and packed in closed cassettes what makes reagent handling completely automated. According to the manufacturer, Cobas 6000 analyzer module c501 performs 600 analyses per hour and sets 130 different applications in various body fluids.
Reagents
All measurements were performed with single lot cassettes except for IgM where analysis of between-day imprecision and therefore inaccuracy was performed with two different reagent lots. Reagent preparation and setting was made according to Roche diagnostics recommendation. All calibrations were performed with commercial calibrators and according to manufacturer’s instructions (7). Calibrations were performed when quality control measurement was not satisfactory or after reagent lot change (IgM). All reagents, calibrators and controls used were provided by Roche diagnostics, Mannheim, Germany.
Samples
We tested 30 analytes in blood serum as listed in table 1. Commercial control samples were used for determination of between-day imprecision and for calculation of inaccuracy (bias) (Precinorm U lot 17959600, Precipath U lot 17628700, Precinorm Protein lot 18234300, Precipath Protein lot 18234400, Precinorm Lipid lot 18064700 and Precipath H/LDL lot 18174000, Roche diagnostics, Mannheim, Germany). For determination of within-day imprecision and for method comparison fresh residual patients’ samples from daily routine were used. Samples were non-randomly selected to fulfill criteria for broad value range and proper distribution for methods comparison. Only non-hemolytic and non-lipemic sera were used.
Imprecision and inaccuracy
Two patients’ samples, each with different decision level (analyte concentration) were used for obtaining within-day imprecision. Each sample was measured 20 times in series, and mean, standard deviation and coefficient of variation (CV) were calculated for each level of repeated measures. Mean value of both coefficients of variation was considered as final coefficient of variation for within-day imprecision (CVwd). Between-day imprecision was calculated based on analyses of commercial control samples, one with normal and one with pathological values (Roche, Mannheim, Germany) over 30 days period. Mean of coefficients of variation for both measured controls levels was considered as final coefficient of variation of between-day imprecision (CVbd). Between-day imprecision (CVbd) was considered to be the measure for random analytical error (8).
Results of commercial control material analysis for between-day imprecision measurements were also used for inaccuracy calculations (bias). We calculated percentage of bias according to equation:
Bias (%) = ((Mean value – Target value)/
Target value) × 100%.
Target value) × 100%.
Inaccuracy was considered to be the measure for systemic analytical error (8). Target values for selected analytes in commercial controls were provided by the reagent manufacturer (Roche, Mannheim, Germany).
Results on imprecision and inaccuracy were evaluated according to quality specifications recommended by European Working Group (9).
Total error
Data on inaccuracy (bias) and imprecision (CVbd) were used for calculation of total error (TE) according to equation (6):
TE = Bias + Z × CVbd.
Total error (TE) represents overall error that occurs as combined effect of random error (imprecision) and systemic error (inaccuracy) in analytical measurement. Factor Z is multiplier that sets confidence level. Recommendations for Z value are not completely harmonized and Z can range from 2 to 6, the higher the value the stricter the rule (6). We calculated total error using Z = 2 and compared our results with recommended quality specifications e.g. total allowable error (TEa) according to European Working Group (9).
Method comparison
We compared results of analysis obtained on Cobas 6000 analyzer series module c501 with results obtained on currently used routine biochemistry analyzer, Beckman Coulter AU640 (Beckman Coulter, USA) for all investigated methods (Table 1). For each analyte we performed measurements of 50 patients’ samples in period of one month. Samples were analyzed on both analyzers at the same day so there was no need for sample storage. We performed Passing and Bablok regression analysis for data of all analytes. Regression analysis provided linear equation for each tested analyte as well as 95% confidence interval (95% CI) for intercept and slope. Methods were considered harmonized if 95% CI for intercept included value zero and 95% CI for slope included value one. If 95% CI did not include listed values, proportional and constant error could be identified (10).
Table 1. Methods of determination for analytes on Cobas 6000 analyzer series module c501 and Beckman Coulter AU640 (Linearity ranges are stated by the manufacturer)
Statistical analysis
All measured data were entered in relation tables using MS Excel (Microsoft Corporation, USA). Computation and statistical analysis were made using MedCalc statistical software (MedCalc, Mariakerke, Belgium, licence of Department of Medical Informatics, Rijeka University School of Medicine, Rijeka, Croatia).
Whole validation experiment was performed at Clinical Institute of Laboratory Diagnostics, Rijeka Clinical Hospital Center, from February to April 2009.
Results
Results of validation of method performance are presented in table 2 as mean of within-run CV, total imprecision, total inaccuracy and total error for all analytes. Quality specifications for imprecision, inaccuracy and total error for each analyte are presented in order to compare obtained with recommended values (9).
Table 2. Within-run imprecision data (N = 20) and between-day imprecision data (N = 30) for Cobas 6000 analyzer series module c501, Total imprecision is mean CV value of between-day coefficient of variation given for two levels of control material, Total inaccuracy as deviation percentage of mean measured value vs. target value (bias = ((mean value-target value)/target value) × 100%), Total error (TE) as quality characteristics of validated method according to equation TE = bias + 2 x CV (6), the net or combined effect of random (total imprecision) and systematic (inaccuracy) errors. All measured and calculated values are compared with given quality specifications (9)
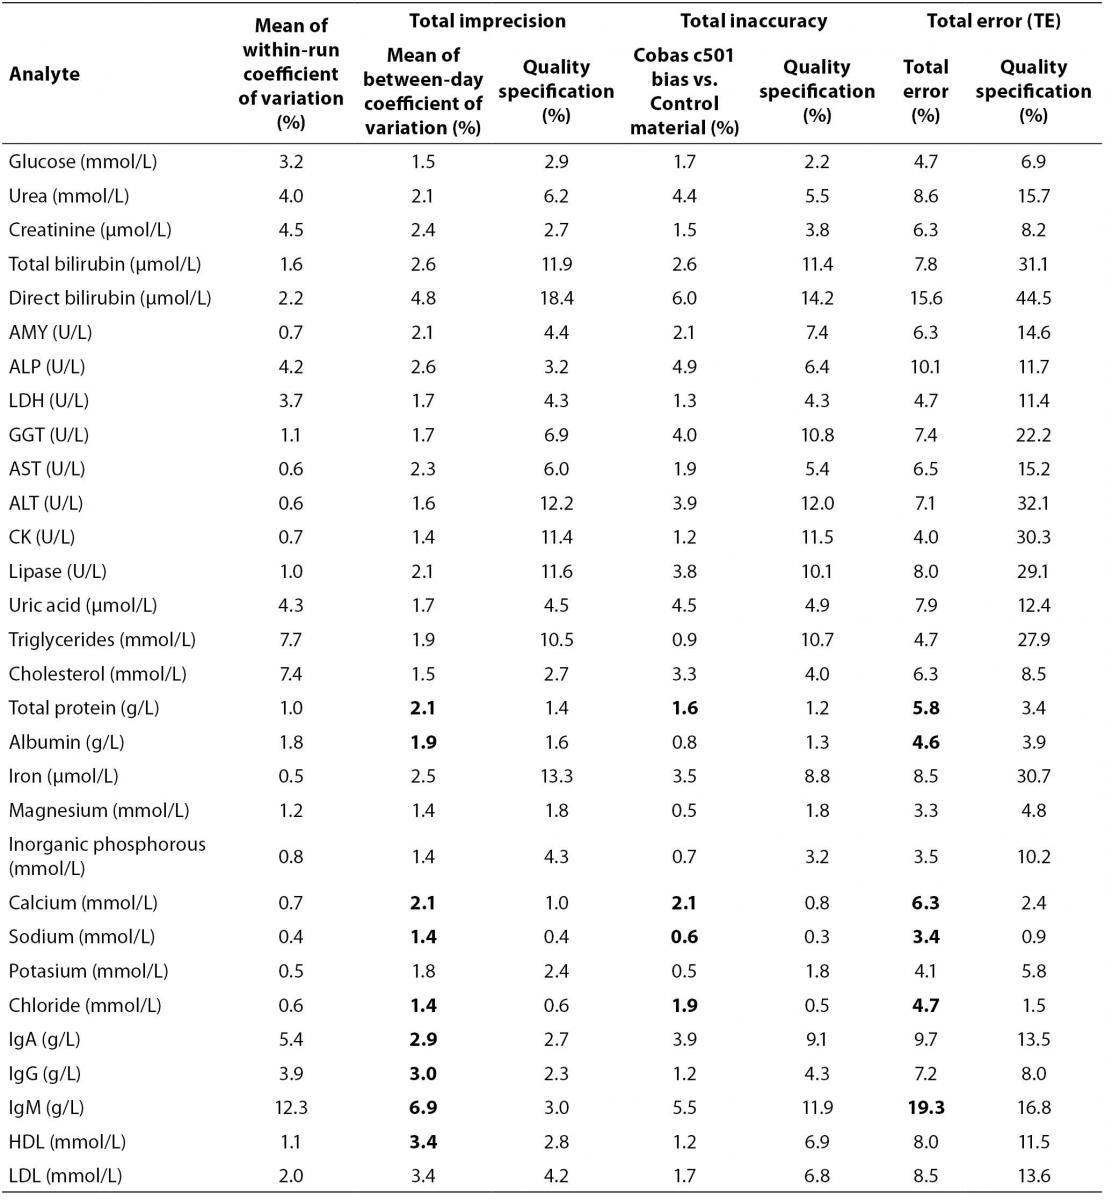
Coefficients of variation (CVwd) for within-day imprecision for majority of tested analytes were below 5% except for cholesterol, triglycerides, IgA and IgM that were 7.4%, 7.7%, 5.4% and 12.3% respectively (Table 2). Coefficients of variation for between-day imprecision (CVbd) for all analytes were below 10% but when compared to quality specifications, total protein, albumin, calcium, sodium, chloride, IgG, IgA, IgM and HDL cholesterol are higher than recommended. When comparing total inaccuracy (bias) with quality recommendations, total protein, calcium, sodium and chloride are not in accordance with recommended specifications. Results for total error revealed that total protein, albumin, calcium, sodium, chloride and IgM have higher total error value than recommended (Table 2).
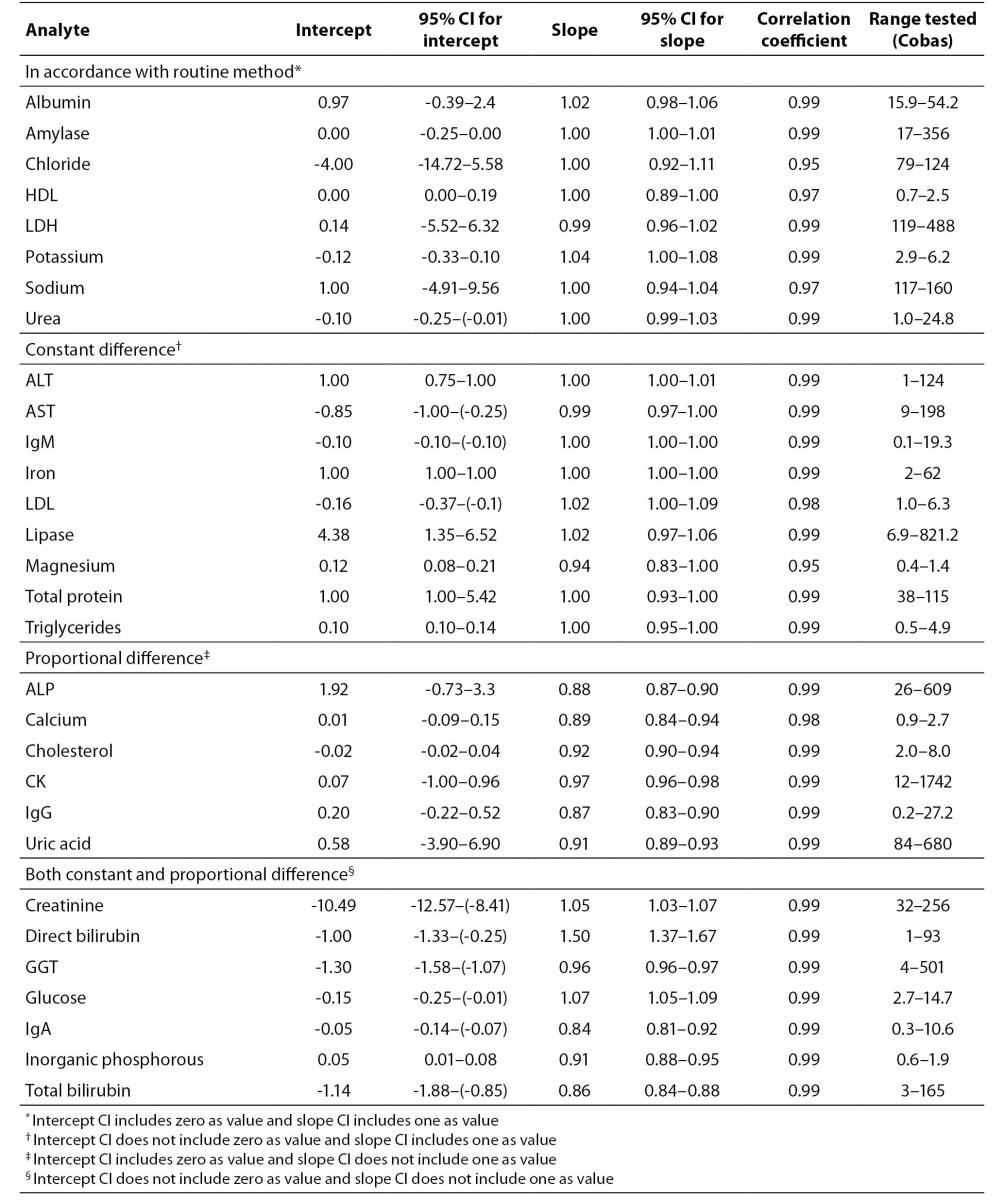
Method comparison study yielded coefficient of correlation r > 0.98 for majority of analytes except for HDL cholesterol (r = 0.97), sodium (r = 0.97), magnesium and chloride (r = 0.95 for both) (Table 3). Linear equations for all tested analytes as well as 95% CI for intercept and slope, calculated according to Passing and Bablok regression analysis are presented in table 3. Full accordance between two methods were achieved for albumin, amylase, chloride, HDL cholesterol, LDH, potassium, sodium and urea, because 95% CI for regression line intercept includes value zero and 95% CI for slope includes value one. Method comparison regression analysis for AST, ALT, IgM, iron, LDL cholesterol, lipase, magnesium, total protein and triglycerides revealed constant difference (intercept 95% CI does not include value zero), and for ALP, calcium, cholesterol, CK, uric acid and IgG proportional difference (slope 95% CI does not include value one). Both, constant and proportional differences, were found for glucose, creatinine, direct bilirubin, total bilirubin, GGT, inorganic phosphorous and IgA.
Table 3. Results of method comparison between Cobas 6000 analyser series c501 and Beckman Coulter AU640. Intercepts and slopes with 95% CI according to Passing and Bablock regression analysis and correlation coefficient are presented
Discussion
Cobas 6000 analyzer series modul c501 is stable analytical system for routine laboratory work. That is supported by results for within-run coefficient of variation that is generally lower than 5% (except for triglycerides, cholesterol, IgA and IgM) and for between-day coefficient of variation lower than 10% for all tested analytes (Table 2). Our results on validation are consistent with those published by van Gammeren et al. (11). Although results are presented in different manner, data for total imprecision can be compared, and no significant difference between obtained results is noted (11).
As we focused mainly on methods performance rather than instrument validation our results were observed in detail according to recommended quality specifications for each method. There are no uniform requirements for quality specification accepted globally (12-15). The choice of quality specification depends on laboratory management and we accepted European Working Group recommendations (9).
When comparing values of CV and bias obtained in our study, with quality specifications recommended by European Working Group, results for some analytes do not agree with recommendations (9) (Table 2). For total protein, albumin, calcium, sodium, chloride, IgA, IgG and IgM, and HDL-cholesterol, CV is higher than recommended, and for total protein, calcium, sodium and chloride bias is also higher than recommended by quality specification (Table 2). Evaluation of quality of methods through CV and bias separately can be complex and inconclusive. CV and bias are performance characteristics of measurement procedures, but better quality indicator is total error that describes maximum error that can occur as consequence of imprecision and inaccuracy of particular analyte measurement (6).
When we observe our results in the terms of total error and compare them with European quality specification for allowable total error, slightly different conclusions can be derived. Total protein, albumin, calcium, sodium, chloride and IgM did not meet quality specification criteria for total error (Table 2). Analytes that did not meet quality specifications for CV and for bias, failed to meet quality specification for total error as well (total protein, calcium, sodium and chloride). However, IgA, IgG and HDL-cholesterol failed to meet CV criteria but were acceptable according to total error quality specification. Although albumin and IgM have acceptable bias, discrepancies from recommended CV value were high enough to influence total errors that were higher than recommended quality specification. Recommended quality specifications for allowable total error by European Working group are more demanding than, for example US CLIA (Clinical Laboratory Improvement Amendments) recommendations (16,17). If we used CLIA recommendation, all analytes that did not meet European quality specifications with the exception of IgM would meet CLIA criteria for allowable total error. The possible reason for poor performance of IgM may lay in two reagent lots that have been used during the validation experiment. Both reagents were calibrated with commercial calibrators according to manufacturer’s recommendations and passed commercial quality control criteria (7).
Factor that strongly influences total error value is Z-value used for calculation of TE. Total errors in our study were calculated using factor Z = 2, however recommended quality specifications for allowable total error by European working group were given using factor Z = 1.65. Considering that higher Z value means stricter rule, we used higher value than the one recommended by European working group and thus made our quality parameters more demanding. The choice of Z value depends on quality policy of laboratory (6). Unstable environment such as routine laboratory is controlled every day with commercial control samples so it allows consideration of factor Z = 2 as satisfactory. Higher stability of analytical systems would allow fewer controls (6). Methods that do not fulfill quality specification criteria should not be declared unsatisfactory but as methods with lower stability. Those methods should be controlled more often and followed with more attention because of higher possible maximum error in method performance (6,18).
Method comparison is inevitable procedure when new analytical system is introduced in routine laboratory work. Regardless of results of method performance validation based on CV, bias and TE, new methods have to preserve continuum in medical decision process so it is important that they do not differ significantly from those currently used (18). We used Passing and Bablock regression analysis for method comparison evaluation even though some authors recommend use of difference plots (Bland and Altman analysis) to present data from method comparison study because they provide more information on random errors (10,19). Our aim was rather to estimate systematic errors, both constant and proportional in order to harmonize tested analyzers.
According to our results of method comparison experiment, methods for albumin, amylase, chloride, HDL-cholesterol, LDH, potassium, sodium and urea were in full concordance with methods of existed automated analyzer (Beckman Coulter AU640, Beckman Coulter, USA). Methods that do not completely fulfill criteria for full concordance (Table 3) generally have small constant and proportional difference that can be compensated by slight adjustment of slope and intercept except for direct bilirubin. That method has significant proportional difference (slope = 1.50) and both instruments cannot be used simultaneously in routine laboratory work for measurement of direct bilirubin.
The limitation of study is that the main question remains, whether those methods that did not fulfill strict performance criteria influence clinical quality requirements which are basis for identifying medically important changes (20). One of the limitations is the exclusion of hemolytic and lipemic samples from method validation as we did not include interference analysis in our study. Another limitation is the usage of control material provided by the manufacturer of the tested analyzer as other control materials from independent manufacturer were not available. Evaluation of each method was performed using single lot reagent with the exception of IgM. Although this can be considered as limitation of the study, validation is a compromise of cost and risk (5). Our study only accessed analytical performance of the specified methods. Validation of analytical performance should never be mixed with clinical quality requirements. There are different protocols for clinical quality requirement evaluation that were not included in our study (21-23).
To conclude, Cobas 6000 analyzer series module c501 provides stable analysis for wide range of analytes. Analytes that do not fulfill quality specification criteria (total protein, albumin, calcium, sodium, chloride and IgM) require more frequent quality control protocol which includes several runs of control material in series. Also, there is need for continuous monitoring of bias and CV in routine laboratory work and stricter rules for allowable CV and bias (18). Additional comparison study for direct bilirubin method adjustment needs to be performed in order to harmonize it with existent instrument.
Acknowledgements
We thank Roche Diagnostics for reagent supply for validation study.