Introduction
Calcium as an essential regulator in many homeostatic systems plays an important role in controlling diverse biological process such as hormone secretion, intermediary metabolism, and bone structure (1-3). Recently it has been suggested that some of metabolic disorders, hypertension and cardiovascular disease are linked by common defects in metabolism of some divalent cations such as calcium and magnesium (4,5). The positive relationship between serum calcium and cardiovascular disease (6) metabolic syndrome (1) or myocardial infarction (7) has been reported in previous studies. On a parallel note, several studies have reported an inverse relationship between serum magnesium concentrations and lipid profile (8,9). Low serum magnesium is associated with cardiovascular events and metabolic syndrome (10). Although the exact mechanisms underlying these relationships are not fully understood, potential mechanisms is the basic role of these cations in metabolic pathways (11). It can be concluded from the above introduction that serum calcium and magnesium are considered as good predictors of lipid abnormality; however one important unanswered question is that whether this relationship can be happened in healthy normal individuals without cardiovascular disease and other morbidities. Previous studies were carried out in diabetes (12), hypothyroidism (13) or metabolic syndrome (1) and not in normal subjects; therefore the aim of this study is to investigate the relationship of serum calcium, magnesium and phosphorus with lipid profile in healthy Iranian premenopausal women.
Methods and materials
Subjects
The study was conducted at Nutritional research center, Tabriz University of medical science between January and July 2008. Subjects were recruited through advertisement with letters which were sent to randomly selected homes in eastern region of Tabriz city. These letters included information about general inclusion criteria of the study. A total of 82 healthy volunteer women were participated in our study. Subjects were divided into obese (N = 40) and non obese (N = 42) groups based on their body mass index. The inclusion criteria of study were 17-50 years of age, BMI 30-34.9 kg/m2 for obese and 18.5-24.9 kg/m2 for non obese group. The exclusion criteria included a history of hepatic or renal disease, cardiovascular disease, diabetes, hypertension, treatment with estrogen and contraceptives (OCP), loop diuretics or corticosteroids. Subjects in the two groups were pair matched for age. Matching limit for age was ± 3 years. The study protocol was approved by ethics committee at Tabriz University of medical sciences and all subjects gave their written informed consent to participate in this study.
Biochemical measurements
Venous blood samples were collected from all subjects between 7 and 9 a.m. after an overnight fasting in tubes without additives. These samples were centrifuged; the serum was obtained and stored at -70°C until the assay. Serum concentrations of calcium, magnesium and inorganic phosphate were measured using standard colorimetric methods (kits from Darman- Kave Co., Esfahan, Iran; Ziest Chem Co., Tehran-Iran and Cheme Enzyme Co., Tehran-Iran respectively). Serum parathyroid hormone (PTH) was measured with ELISA (Bio source Europe S.A, Nivelles, Belgium). The sensitivity of this test was 2 ng/L and means inter and intra assay coefficients of variation (CV) were 7.1 and 1.1% respectively (14). Serum 25-hydroxy vitamin D was measured by Chemiluminescence Immuno Assay (DiaSorin Inc., Stillwater, MN, USA). Sensitivity of this test was 17.5 nmol/l and means inter and intra assay coefficient of variation was 13.2% and 10.5% respectively. We also categorized subjects into three groups according to their serum calcium or phosphorous levels: groups with low, medium and high serum calcium or phosphorous levels.
Fasting blood glucose (FBG), total cholesterol (TC), triglyceride (TG) and high density lipoprotein cholesterol (HDL-C) levels were analyzed using enzymatic colorimetric method. The TG level in all subjects was lower than 4.52 mmol/L (400 mg/dL); therefore we used Friedwald formula for estimation of Low Density Lipoprotein Cholesterol (LDL-C) concentrations based on serum TC, TG and HDL levels (15). Mean inter and intra assay CV were 1.14, 0.061 for TC; 1.60, 1.53 for TG and < 4 for HDL respectively.
Anthropometric and dietary assessments
Weight was measured to the nearest 0.1 kg using a calibrated Seca scale (Itin Scale Co., Inc. Germany) while subjects had light clothes and no shoes. Height was measured using a cotton ruler which was attached to wall. Body mass index was calculated as weight (kg) / height (m)2. Waist circumference (WC) was obtained by measuring the smallest area below the rib cage and above the ambilicus. Standing hip circumference (HC) was measured at the inter trochantric level (16) Waist to hip ratio (WHR) was obtained by dividing the mean WC by the mean HC. Each participant had a body composition analysis with Bioelectrical Impedance Analysis (BIA) method (Human-IM Plus; DS Dietosystem, Milan, Italy). Demographic characteristics of subjects were determined using a screening questionnaire to provide information on general personal characteristics, health status, medication history and a history of previous medical disease. To assure that there is no difference between dietary calcium, magnesium and vitamin D intake between obese and non obese subjects, a three day diet record was obtained from participants. Average daily nutrient intakes were calculated by Nutritionist Ш software (N-Squared analytical software computing, Ore., USA). Intake of magnesium, calcium and vitamin D that are correlated with total energy intake was adjusted for total energy intake with residual method (17).
Statistical analysis
SPSS software (version 17, SPSS Inc., Chicago, IL, USA) was used for all analysis. The Kolmogorov-Smirnov test was used to verify the hypothesis of normal distribution, followed by the independent Student’s-ttest supposing normal distribution, and the Mann-Whitney U test was used, when the supposition of normal distribution was not accepted. The association between serum calcium, magnesium and phosphorous with fasting blood glucose and lipid profile was examined by using the Pearson’s correlation test or by Spearman’s rank correlation test.
Since BMI, WHR, PTH and 25-hydroxy vitamin D influence the calcium metabolism, the above mentioned association was reassessed by multiple regression analysis with excluding the confounding effect of these variables. In addition, subjects were categorized by tertiles into three groups according to serum calcium or phosphorous concentrations: groups with low, medium and high serum calcium or phosphorous concentrations. Kruskal-Wallis test was used to analyze the differences in serum lipids among three groups with Bonferroni corrections for multiple comparisons (18). Continuous variables are expressed as mean ± SD if they had normal distribution or median and Interquartile range (Q1-Q3) if not. Age was presented as median and range (maximum-minimum). P values less than 0.05 is considered significant.
Results
Profile of obese and non obese groups are shown in table 1. All general characteristics are significantly different between groups except for age and dietary intake of calcium, magnesium and vitamin D. Comparison of biochemical parameters between obese and non obese women (table 2) shows that serum FBG, TC, TG, LDL-C and PTH concentrations is higher and serum magnesium is lower in obese group. There is no significant difference between serum calcium, phosphorous, HDL-C and 25-hydroxy vitamin D concentrations between groups. In correlation coefficient analysis (table 3) serum calcium concentrations had a positive weak correlation with TC (r = 0.267, P = 0.013), TG (r = 0.301, P = 0.005), and 25-hydroxy vitamin D concentrations (r = 0.303, P = 0.034) in all participants; whereas in separate analysis of subjects as obese and non obese groups, these relationships were not significant. Correlation coefficient is also significant for the inverse weak relationship between serum magnesium concentrations and BMI, weight, WC, fat mass and for positive relationship between serum magnesium and fat free mass.
Table 1. Characteristics of study participants.
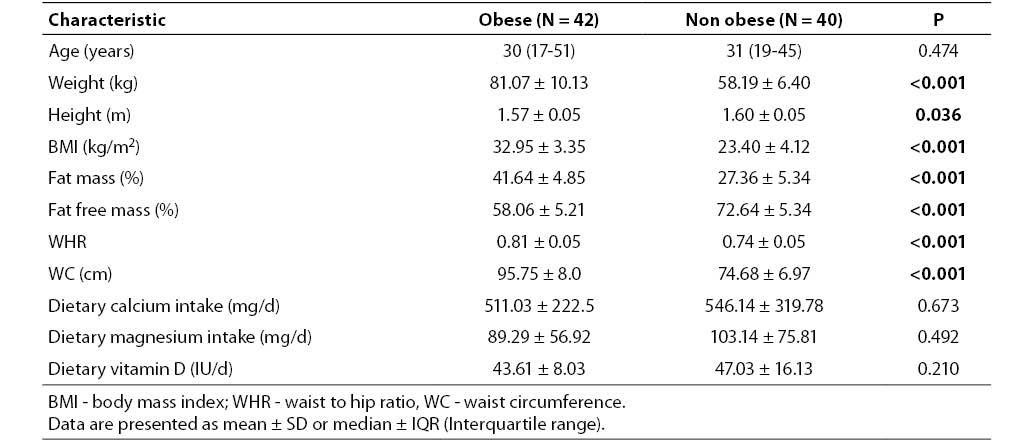
Table 2. Biochemical characteristics of study participants.
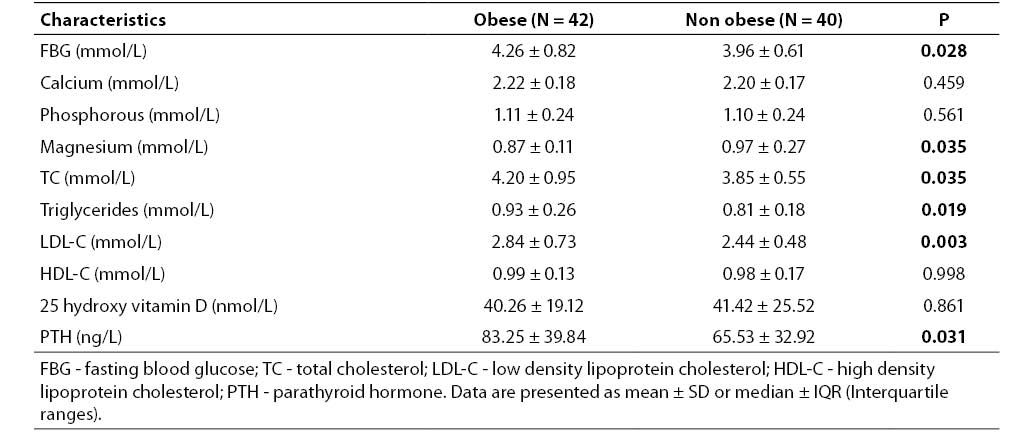
Table 3. Correlation coefficient (with P values in brackets) for serum calcium, magnesium, phosphorous in relation to lipid profile and body composition in total participants.
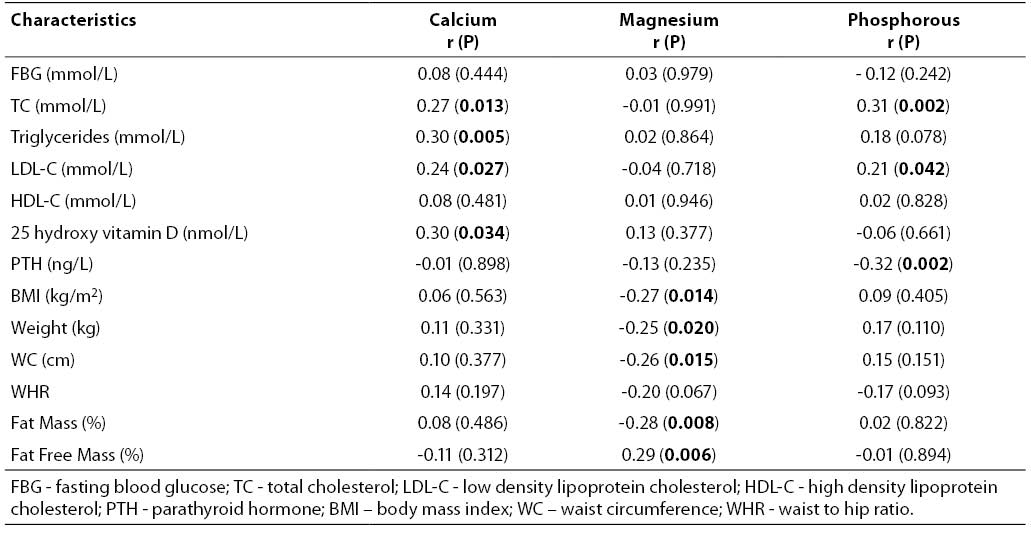
Serum phosphorous had a weak positive relationship with total cholesterol (r = 0.310, P = 0.002) and a weak negative relationship with parathyroid hormone (r = - 0.342, P = 0.002). After controlling for confounding variables in multiple regression analysis serum calcium had a positive relationship with TG, LDL-C and HDL-C (table 4).
Table 4. Multiple regression analysis between serum calcium, fasting blood glucose and lipid profile (adjusted for 25-hydroxy vitamin D, PTH, BMI and WHR).

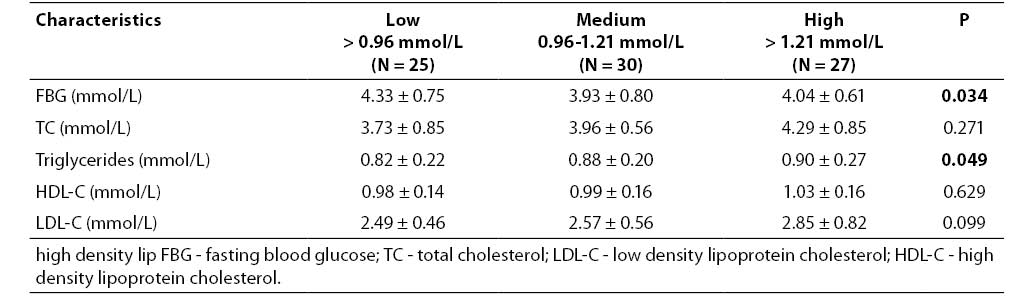
Subjects with higher serum calcium concentrations had significantly higher levels of TC, TG and LDL-C compared with the corresponding levels in the subjects with low and medium calcium concentrations (P = 0.028, 0.045 and 0.038 respectively; Table 5). Post- hoc analysis has revealed that the mean level of TC in high calcium group was higher than in low and medium calcium groups (P = 0.032 and 0.026 respectively). TG and LDL-C in this group was also higher than low calcium group (P = 0.044 and 0.024 respectively). In comparison of subjects classified by serum phosphorous levels, subjects with higher levels of serum phosphorus had significantly higher fasting blood glucose and lower triglycerides (P = 0.034, 0.049 respectively; Table 6). According to post-hoc analysis results, the differences between FBG and TG among groups, were significant between medium and high phosphorous groups (P= 0.002 and 0.025 respectively).
Table 5. Fasting blood glucose and serum lipids of study subjects base on blood calcium tertiles.
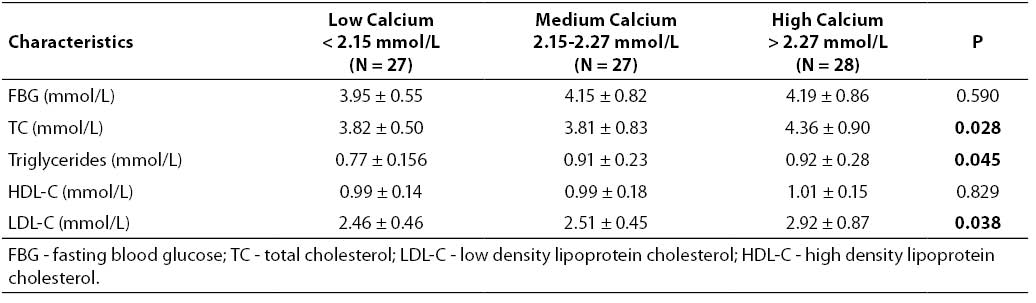
Table 6. Fasting blood glucose and serum lipids of study subjects base on blood phosphorous tertiles.
Discussion
This study demonstrates that serum calcium is positively associated with lipid profile in premenopausal women. This association remained significant after adjusting for potential confounders (BMI, WHR, PTH and 25-hydroxy vitamin D). Subjects with higher serum calcium levels had higher serum TC, TG, and LDL-C. Since the menopausal status has significant influence in lipid and calcium metabolism (19,20), the study groups were selected from premenopausal women. The first report of association between serum calcium and lipid profile (TC, HDL-C) was in De Bacquer et al. (21) study; although, the effect of potential confounding variables was not regarded in this report. Lars Lind and colleagues (1) found positive relations between blood pressure, serum glucose and cholesterol with serum calcium concentrations by including only BMI, age and BUN as confounding variables. In a cohort of males aged 50 serum calcium was also defined as an independent prospective risk factor for myocardial infarction (7). There are several potential mechanisms that may explain the association of serum calcium and lipid profile. The average concentrations of serum PTH in our study sample was 76.2 ± 39.01 ng/L, whereas the normal range for serum PTH concentrations is 10-65 ng/L (22), this elevated PTH concentrations leads to excessive calcium accumulation in cytosol, PTH induced calcium entry into cells inhibits mitochondrial oxidation and ATP production and ultimately increasing intracellular calcium (23); Increased cytosolic calcium is responsible for disturbance in lipid metabolism and inducing hyperlipidemia (24-28). Calcium ions are necessary for insulin production by islet cells of pancreas and increased intracellular calcium concentrations may also induce insulin resistance and lipid abnormality (29). High serum PTH level has also suppressive effect on the lipoprotein lipase activity (24). Abnormality of this enzyme may result in increased triglyceride, low density lipoprotein cholesterol and decreased high density lipoprotein cholesterol (23). These mechanisms can somewhat explain the relationship between serum calcium and lipid profile, however due to the case - control design of the study, we are not able to clarify the causal nature of these relationships.
Subjects with higher serum phosphorous levels had significantly higher levels of triglyceride concentrations than their controls. Other anthropometric or biochemical variables were not different between serum phosphorous groups except in the case of PTH (In low, medium and high phosphorous groups: 89.91 ± 43.03, 76.17 ± 39.16 and 63.88 ± 31.45 ng/L respectively; P = 0.040). This finding is in consistent with other researchers work such as Dhingra R et al. (30) and Park W. et al. (31). The biological mechanisms of the phosphate and triglyceride relationship are not fully understood. A possible mechanism which has been explained by Park W. (31) is that serum phosphate affect phospholipids metabolism in the liver. Another mechanism is diminishing lipoprotein lipase activity due to higher parathyroid hormone concentrations which consequently leads to abnormal lipid metabolism (24).
Another observation of our study is the significant difference between serum magnesium concentrations between obese and non obese women. This finding agree with that of Huetra et al. (5), as proposed by this authors lower dietary magnesium intake in obese individuals may be the main reason for magnesium deficiency in obese group, however as shown in table 1 magnesium intake in obese and non obese groups was not significantly different; the link between obesity and magnesium deficiency can partially be explained by inflammatory markers. Rodriguez (32) and Hauner (33) found a strong relationship between low serum magnesium and high tumor necrosis factor α (TNF-α) in obese subjects. Guerrero (34) and Laimer (35) in similar studies reported negative relation between serum magnesium and C-reactive protein in obesity. Production of inflammatory cytokines by adipose tissue is the cause of increased inflammatory markers in obesity. Cytokines such as TNFα and Interleukine-6 (IL-6) are secreted by adipose tissue (36,37). The cause and effect relationship between serum magnesium and inflammatory markers in obesity is poorly known. One possible mechanism is that inflammatory factors especially tumor necrosis factors increase renal 1-α-hydroxylase activity and 1,25-(OH)2 vitamin D (38). This active metabolite enhances renal calcium reabsorption and so higher magnesium urinary excretion (39). In addition, low serum magnesium can promote weight gain by increasing intracellular calcium (40). Increased calcium in adipocytes enhances lipogenesis (41). It also activates phosphodiesterase 3B and decrease lipolysis (42).
Similarly elevated serum PTH concentrations in obese group of the present study which has also been reported previously by other investigations (42-44) can be attributed to elevation in calcium influx in to adipocytes due to elevation of 1,25-(OH)2 vitamin D production by PTH; this can promote lipid storage in adipose tissue (44). Another possible cause of increased PTH in obese individuals is altered mineral metabolism; according to previous report of T. Anderson et al changed complex binding of plasma calcium could lead to secondary increase of parathyroid hormone in obesity (45).
Some potential limitations of our study are as follows: first, only women and not men were enrolled in this study, therefore we cannot generalize the results to the total population, second, insulin resistance and inflammatory cytokines were not evaluated, whereas these markers have physiological relations with both mineral metabolism and lipid abnormalities, finally, an interventional study rather than case-control one could better explain the causal relationship between variables. Despite these limitations one important clinical considerations of our study is that calcium and phosphorous levels should be controlled as risk factors of lipid abnormality and consequently metabolic syndrome or cardiovascular disease.
In conclusion, this study showed a significant association between serum calcium and lipid profile even after adjusting for potential confounders (BMI, WHR, serum PTH, serum 25-hydroxy vitamin D,) in a group of premenopausal women. Additional research is warranted to confirm or possibly reject the potential links between these variables and clarifying the underlying mechanisms.
Acknowledgments
This work was supported by a grant from Nutritional research center of Tabriz University of Medical Sciences. We thank all of the participants in this study.