Introduction
Optimal storage of serum specimens in biobanks for a long time for multicenter reference interval studies, or epidemiologic studies remains to be determined.
Specimens shipped from multicenter laboratories are usually stored in a central laboratory for further analysis. Parameters that may vary across collections include; i) delays in shipping frozen samples; ii) power cut or voltage fluctuations of the freezers; and iii) using frost-free freezer that goes through numerous defrost cycles, which may result in loss of some analytes.
Pre-analytical phase is the most critical part of the total analytical process which has impacts on patient reports in clinical chemistry testing (1). It is possible in practice to reanalyze the samples stored to confirm the previous results or to perform additional analysis, however the stability of the analytes must be assured before giving results, or before establishing new investigations. Furthermore, analyzing unsuitable samples often cause high cost expenditures and enlargement of total testing process.
Manufacturers allow the usage of sera stored frozen and thawed only for once, and advise to disperse sera into the single usage aliquots before freezing. However, the number and volume of the aliquots must be taken into account regarding the handling and freezer space costs while planning the studies.
There are various studies examined how storage conditions affected the stability of various serum components (2-5). However, there is less information on the stability of commonly used chemistry analytes in human sera.
The present study examined the stability of 17 routine chemistry analytes in sera after storing at a designated temperature and freeze-thawing at multiple time points.
Materials and methods
Subjects
This study included fifteen out-patients attending the clinics of our hospital. The specimens collected from each patient were for the laboratory testing ordered by the physician. No additional blood was taken from the subjects. All were informed for the study and signed the informed consent. The procedures were in accordance with the guidelines of the Helsinki Declaration on human experimentation.
Study design
Fasting venous blood (totally 25.5 cc blood) was collected in the morning into three 8.5 mL plastic evacuated tubes (BD Vacutainer Systems, Becton-Dickinson, Plymouth, UK). The sample tubes were left in upright position for 30 min at room temperature for complete clot formation. All were then centrifuged at 1800 x g for 10 minutes (according to the instruction of the tube manufacturer). Serum samples were checked visually for hemolysis and lipemia for possible interferences (6,7). Sera of each subject were pooled into a plain tube, and were aliquoted into 1.5-mL Eppendorf (Eppendorf, Milano, Italy) tubes. Composing of 13 aliquots for each patient (three for storage, 10 for freeze-thaw), remaining sera were used for the patients’ requested tests. Following baseline measurement (T0), all were kept frozen until analysis for two experiments below:
· Ten samples of each subject were frozen at -20 °C. After 24 hours, all frozen sera in the Eppendorf tubes of each patient were thawed at room temperature for approximately 1 h until completely thawed, and then mixed properly with automatic pipettes before analysis (freeze-thaw 1).
· Samples were immediately re-frozen at -20 °C for the next study day. This cycle was repeated for ten consecutive days (T1d, T2d,T3d, T4d, T5d, T6d, T7d, T8d, T9d, T10d) to yield freeze- thaw processing.
· A group of sera were stored frozen at -20 °C for up to 1, 2 and 3 months, and then analyzed for stability in singleton at three time intervals (T1m, T2m, T3m).
Samples stored at -20 °C were kept in a freezer equipped with a temperature recorder (Figure 1).
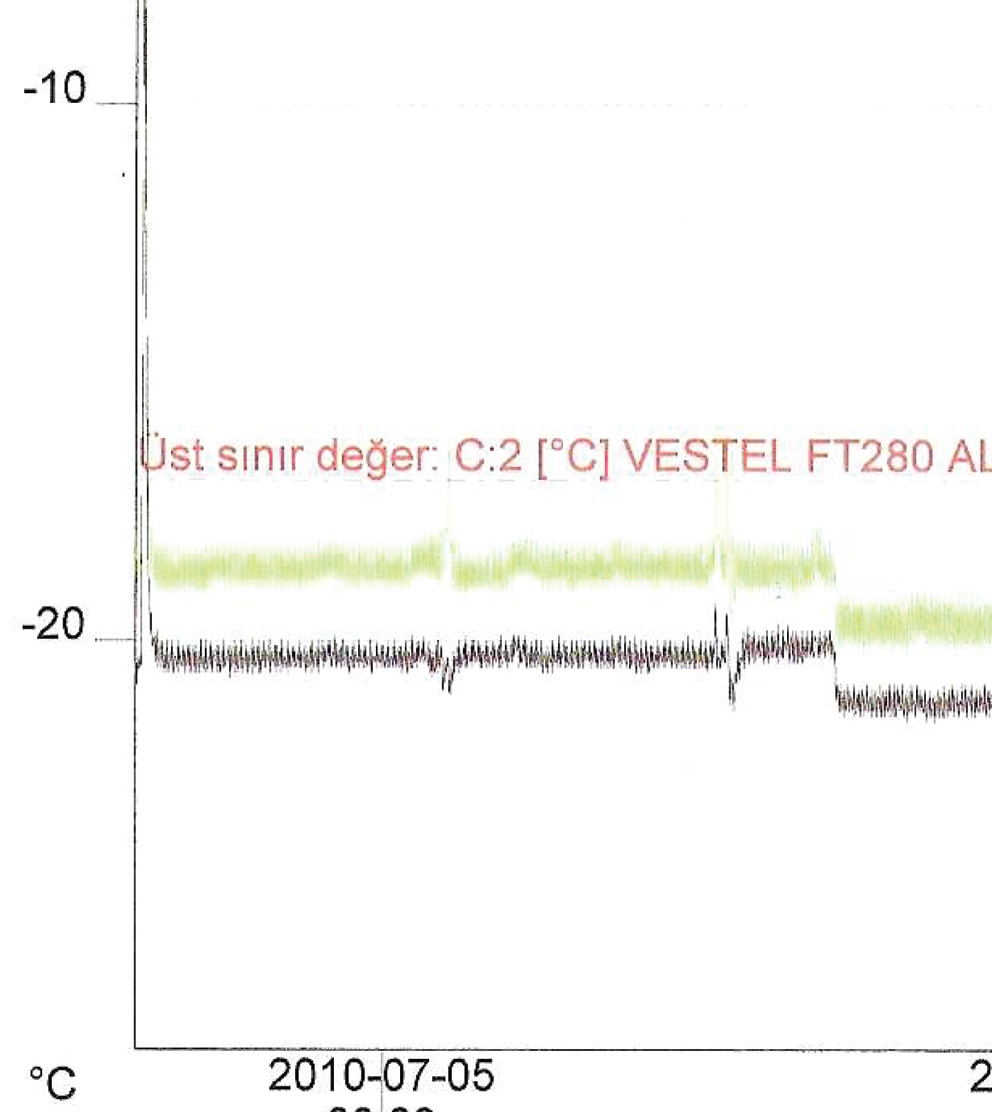
Figure 1. The temperature graph of the freezer during the freeze-thaw period.
Methods
Assays were performed on the Abbott Aeroset analyzer (Abbott, Wiesbaden, Germany) with Abbott reagents at the Department of Clinical Biochemistry Laboratory of Ataturk Training and Research Hospital in Izmir, Turkey. The following biochemical constituents were assayed:
· metabolites: BUN (blood urea nitrogen), calcium, creatinine, direct bilirubin, glucose, total bilirubin, uric acid;
· proteins: total protein, albumin;
· lipids: triglycerides, cholesterol, HDL (high density lipoprotein);
· enzymes: ALT (alanine aminotransferase), AST (aspartate aminotransferase), CK (creatine kinase), GGT (gamma-glutamyl transferase), LD (lactate dehydrogenase).
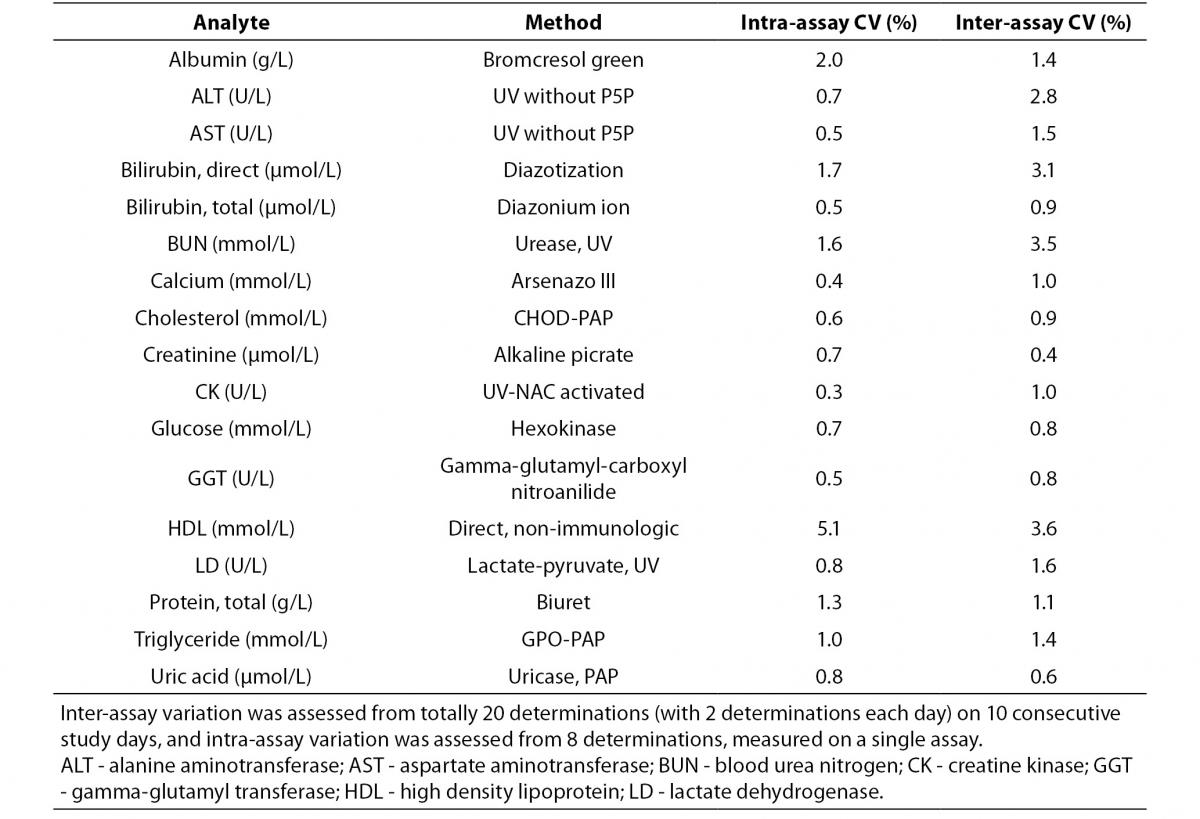
Intra-assay and inter-assay CV’s were performed with pooled patient sera different from the study subjects (Table 1). Inter-assay variation was assessed from 20 determinations (with 2 aliquots each day) on ten consecutive study days, and intra-assay variation was calculated from eight sequental determinations obtained from the first day of the study period.
Table 1. Methods, intra and inter-assay coefficient of variations.
Quality control was performed each day before studying aliquots with two levels of control materials (Bio-Rad Laboratories, Milano, Italy).
Statistical analysis
Stabilities of analytes after freeze thaw cycles and after storage were assessed by percentage change from T0 for paired groups (T0 -T1d, T0 -T2d, etc. and T0 - T1m, T0 -T2m, etc). Bias was calculated by the formula:
[(CX-C1)/C1)] × 100%
C1: the mean or median of the T0 sample;
CX: the mean or median of the experimented sample.
Median or mean changes from T0 concentrations were evaluated both statistically and clinically according to the desirable bias taken from the Westgard QC (8), which was first published at 1999 and updated at 2012 by Ricos et al.
The distribution of the variables was determined using Shapiro-Wilk normality test.
In normally distributed groups, results were presented as mean ± standard deviation. The significant differences from T0 value were determined by Paired samples t-test. For non-Gaussian groups, median variations from T0 was determined by nonparametric Friedman test and Wilcoxon signed rank test using licensed statistical package for Windows, Version 15.0, SPSS Inc. (Chicago, IL, USA). P value < 0.005 (0.05/11 = 0.0045) for freeze-thaw cycles and P < 0.013 (0.05/4 = 0.0125) for storage period were considered statistically significant according to Bonferroni correction for multiple comparisons.
Results
The results and variations for two experiments are presented in table 2 and figures 2 and 3.
Table 2. Percentage of mean ± standard deviation and median (interquartil) changes from T0 values (% change from T0: baseline value) at each freeze-thaw cycle and storage period compared to maximum desirable bias.
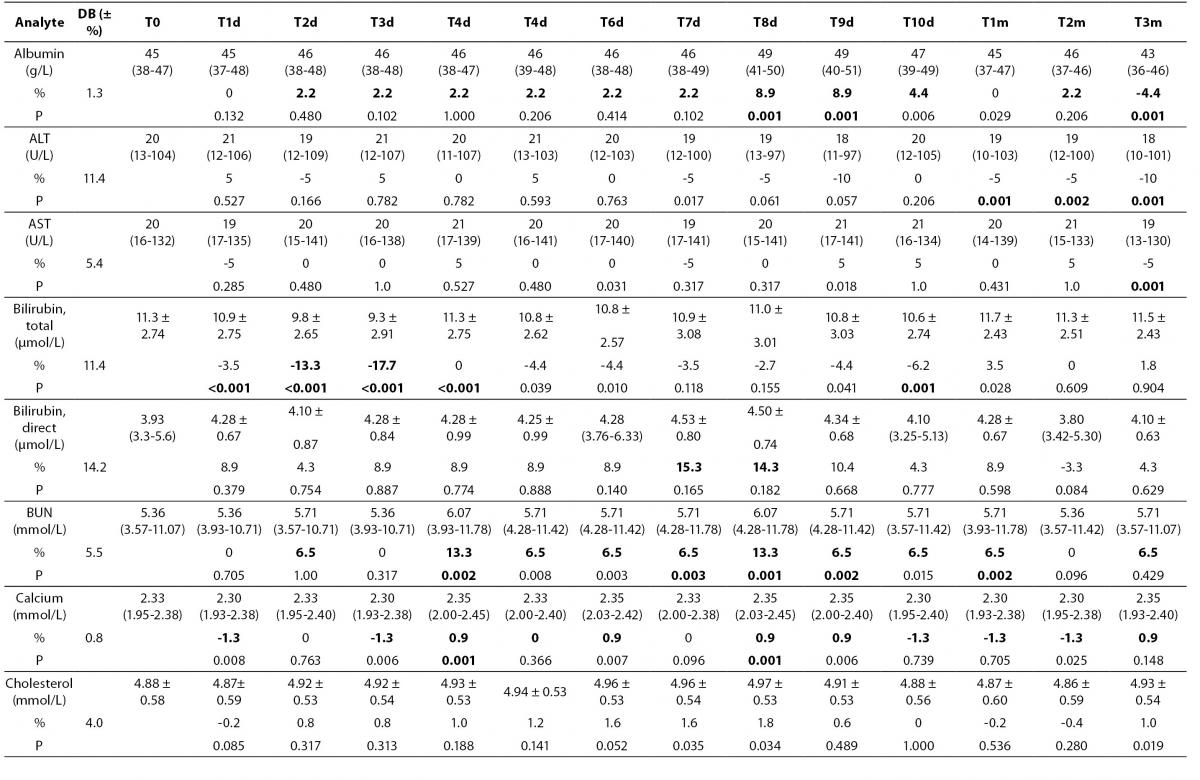
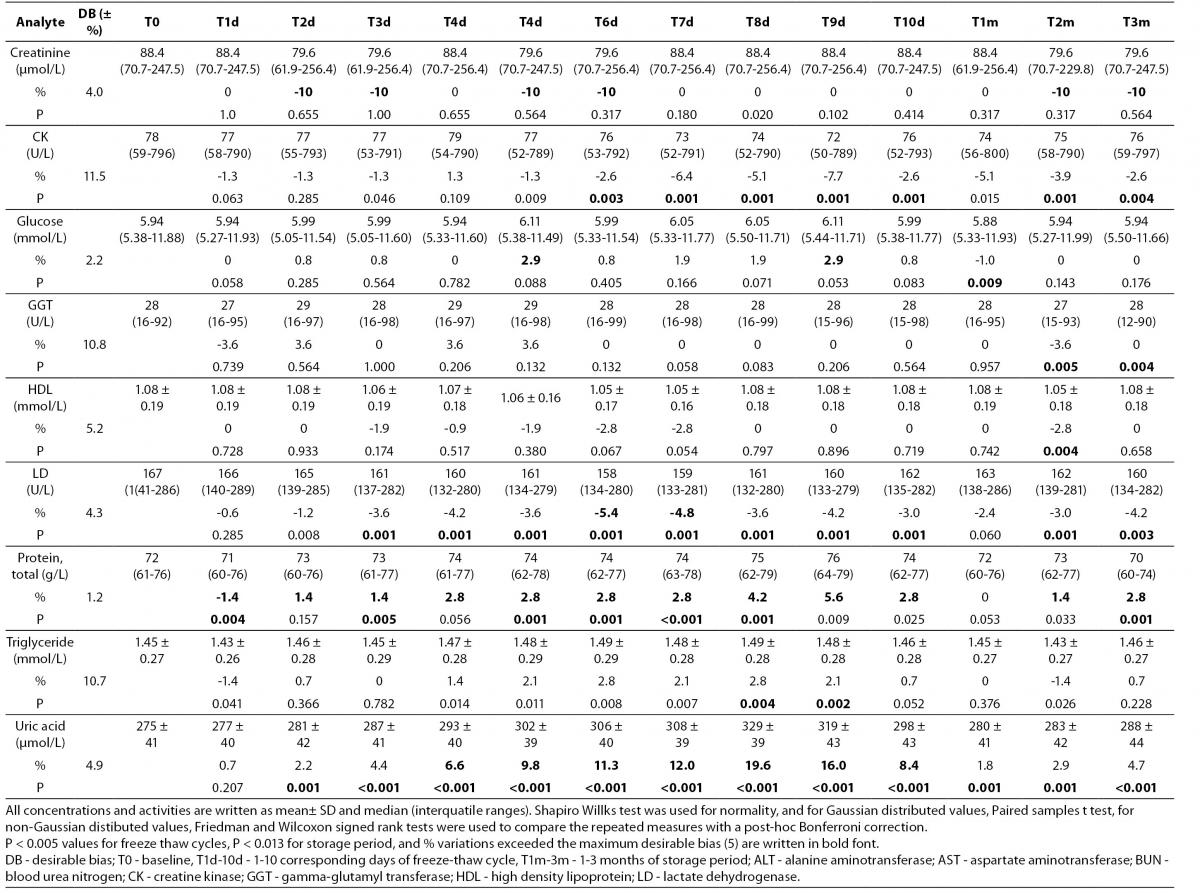
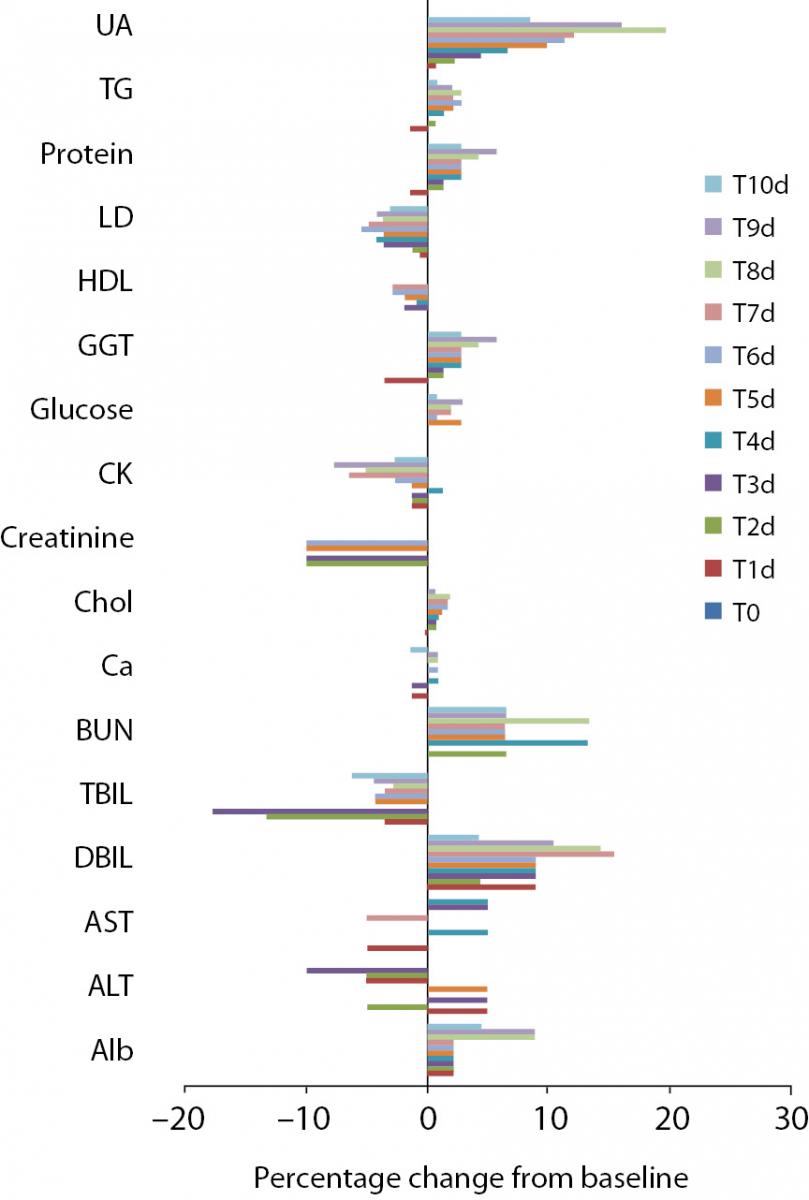
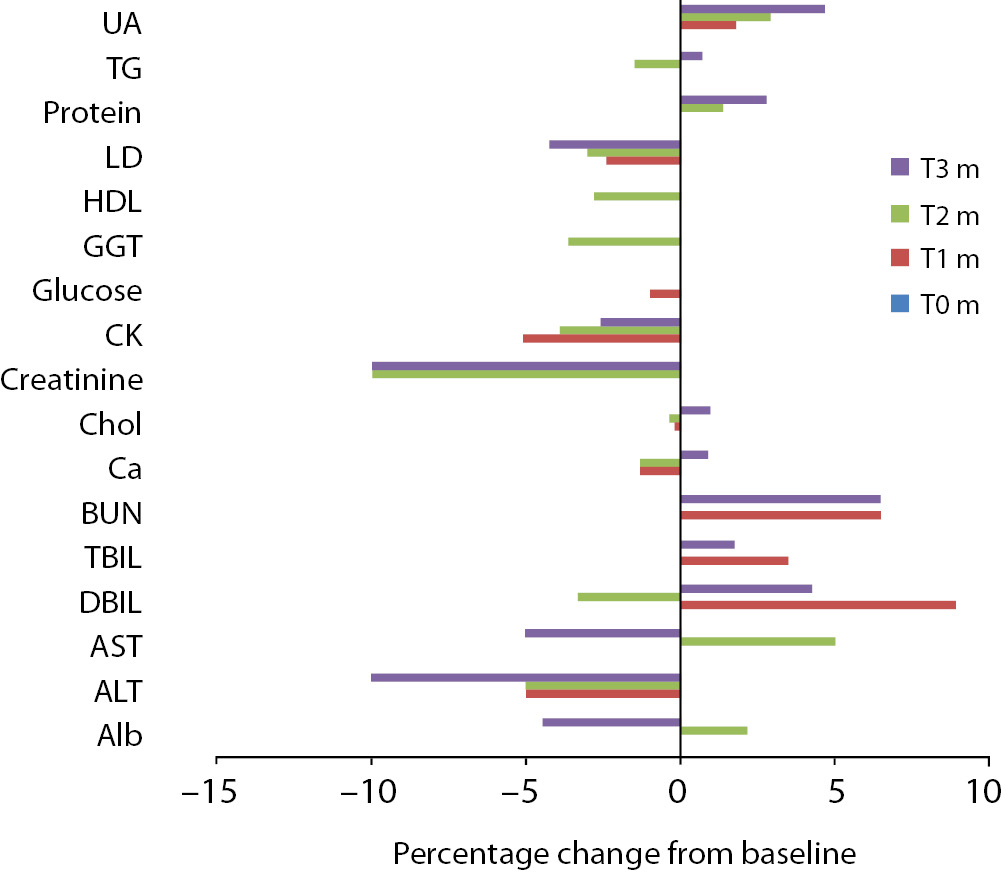
Figure 2. Percentage change in concentrations during 10 days of freeze-thaw period. Figure 3. Percentage change in concentrations during storage for 1–3 months at -20 °C.
Alb - albumin; ALT - alanine aminotransferase; AST – aspartate aminotransferase; BUN - blood urea nitrogen; Ca - calcium; CK - creatine kinase; Chol - cholesterol; D BIL - direct bilirubin; GGT - gamma-glutamyl transferase; HDL - high density lipoprotein; LD - lactate dehydrogenase; T BIL - total bilirubin; TG - triglyceride; UA - uric acid; T0 - baseline, T1d-10d - 1-10 corresponding days of freeze-thaw cycle, T1m-3m – corresponding months of storage.
Freeze-thaw cycles
After samples had been frozen and thawed up to ten times, there were no statistically significant differences for AST, ALT, GGT, cholesterol, glucose, creatinine, direct bilirubin and HDL levels.
Statistically significant changes were not clinically significant for triglyceride and CK. Sera should not go through more than one freeze-thaw cycle for total bilirubin (P < 0.005). Among the analytes studied, total protein and uric acid were found as the least stable tests (Table 2). Albumin concentration was not altered statistically as long as seven freeze-thaw cycles and increased afterwards. BUN and calcium were stable up to three freeze-thaw and LD was found as stable for five cycles evaluating together the significance clinically and statistically. Statistically significant changes were marked in bold in table 2.
Storage at -20 °C
Except from albumin, total protein and BUN levels, there were no significant variations for sera stored until 3 months. Statistical and clinical significances were evaluated for all analytes.
Albumin and total protein concentration changed significantly (P < 0.013) after 3 months of storage. BUN concentration showed variability during storage (Table 2).
Discussion
This study examined the storage and repeated freeze thaw effects on chemistry analytes pre-analytically. According to our findings, 14 analytes after storage and 10 analytes following freeze-thaw cycles showed clinically equivalent results.
In a comprehensive study by Jackson et al. (9) clinically negligible biases were obtained in most of the routine clinical chemistry parameters following repeatedly freeze-thaw cycles between 0 to 24 hour. Cray et al. (10), experimented the storage stability of rat sera at -20 °C for glucose, BUN, calcium, total protein, albumin, AST, ALT, LD and CK when stored in nonfrost freezer up to 90 days. In agreement with Jackson and Cray (9,10), we found glucose concentrations as stable through the whole experiment. However in a study (11), glucose concentrations were found as increased from 11.8 to 14.0% in human serum refrozen and thawn even once.
Protein stability is problematic. Fast freezing with slow thawing resulted in severe damage in proteins, accordingly, slow freezing and fast thawing process is advised to prevent protein denaturation in aqueous solutions (12). In human fluids, long time storage in freezer is advised instead of thawing samples repeatedly (13). The variations for albumin and total protein were found as outside the desirable bias (8) during storage and freezing thawing cycles in this study, however the bias could not be explained by denaturation, as the concentrations were measured as increased.
In accordance with the current study, Paltiel and Comstock et al. (14,15) reported the stability of serum cholesterol and triglyceride concentrations during storage in freezer and following freeze thaw cycles. The present study confirms the findings of Beekhof et al. (16), who found a good stability of HDL up to 6 months of storage at -20 °C.
Paltiel et al. (14), subjected the human plasma samples to several freeze thaw cycles after storage at -80 °C and AST activity was determined as stable within the 10-15 freeze-thaw cycles. Throughout the multiple time points we assessed, all of the enzyme levels measured were biased insignificantly, except from LD activity.
Our results indicate an appreciable increase in BUN values over time, however BUN instability has been observed in a recent study as a large percentage decrease (15.6% average) when samples were stored at -20 °C (17).
The estimated percentage change in uric acid concentrations per freeze thaw cycle showed an increasing trend over time as this analyte was demonstrated as unstable after 48 hours in human serum stored at -4 °C in a recent study (18).
In the present study, time dependent decreases during storage and within the 10 times of freezing cycle were statistically insignificant for creatinine assay.
Total bilirubin concentration was found as stable up to three months of storage at -20 °C, unlike to a study in which authors demonstrated decreases both at -20 °C and at -80 °C (19) after storage even for two weeks. Although total bilirubin concentrations significantly decreased due to freeze-thaw cycles in the present study, practically serum is not stored for this analyte assay for future use in laboratories, considering its photo-sensitivity. In the CALIPER study (17), similar to our study, significant negative slope was observed for total bilirubin in samples stored at -20 °C with a low baseline concentration for a few months, and that relative large bias was attributed to the low baseline analyte concentrations.
The limitation of this study is that the results are based on small patient group size. Secondly, all time measurements were done once because of economical reasons. The pH of the samples was not measured to evaluate the possible bacterial growth in the specimen which may cause erroneously elevated results for urea. Determinations were done with the defined analyzer with its original reagents. Therefore, these results might not be universally reproducible with other testing systems.
As a result, common clinical chemistry analytes, with considering the variability of unstable analytes, showed adequote stability after 3 months of storage in sera at -20 °C, or up to ten times of freeze-thaw cycle. All the same, such analysis can only be performed for exceptional cases, and results must be interpreted with great attention.