Introduction
Study design plays an important role in the quality, execution, and interpretation of biomedical and public health research (1-12). Each study design has their own inherent strengths and weaknesses, and there can be a general hierarchy in study designs, however, any hierarchy cannot be applied uniformly across study design types (3,5,6,9). Epidemiological and interventional research studies include three elements; 1) definition and measure of exposure in two or more groups, 2) measure of health outcome(s) in these same groups, and 3) statistical comparison made between groups to assess potential relationships between the exposure and outcome, all of which are defined by the researcher (1-4,8,13). The measure of exposure in epidemiologic studies may be tobacco use (“Yes” vs. “No”) to define the two groups and may be the treatment (Active drug vs. placebo) in interventional studies. Health outcome(s) can be the development of a disease or symptom (e.g. lung cancer) or curing a disease or symptom (e.g. reduction of pain). Descriptive studies, which are not epidemiological or interventional, lack one or more of these elements and have limited application. High quality epidemiological and interventional studies contain detailed information on the design, execution and interpretation of results, with methodology clearly written and able to be reproduced by other researchers.
Research is generally considered as primary or secondary research. Primary research relies upon data gathered from original research expressly for that purpose (1,3,5). Secondary research focuses on single or multiple data sources that are not collected for a single research purpose (14,15). Secondary research includes meta-analyses and best practice guidelines for treatments. This paper will focus on the study designs and their strengths, weaknesses, and common statistical outcomes of primary research.
The choice of a study design hinges on many factors, including prior research, availability of study participants, funding, and time constraints. One common decision point is the desire to suggest causation. The most common causation criteria are proposed by Hill (16). Of these, demonstrating temporality is the only mandatory criterion for suggesting temporality. Therefore, prospective studies that follow study participants forward through time, including prospective cohort studies and interventional studies, are best suited for suggesting causation. Causal conclusions cannot be proven from an observational study. Additionally, causation between an exposure and an outcome cannot be proven by one study alone; multiple studies across different populations should be considered when making causation assessments (17).
Primary research has been categorized in different ways. Common categorization schema include temporal nature of the study design (retrospective or prospective), usability of the study results (basic or applied), investigative purpose (descriptive or analytical), purpose (prevention, diagnosis or treatment), or role of the investigator (observational or interventional). This manuscript categorizes study designs by observational and interventional criteria, however, other categorization methods are described as well.
Observational and interventional studies
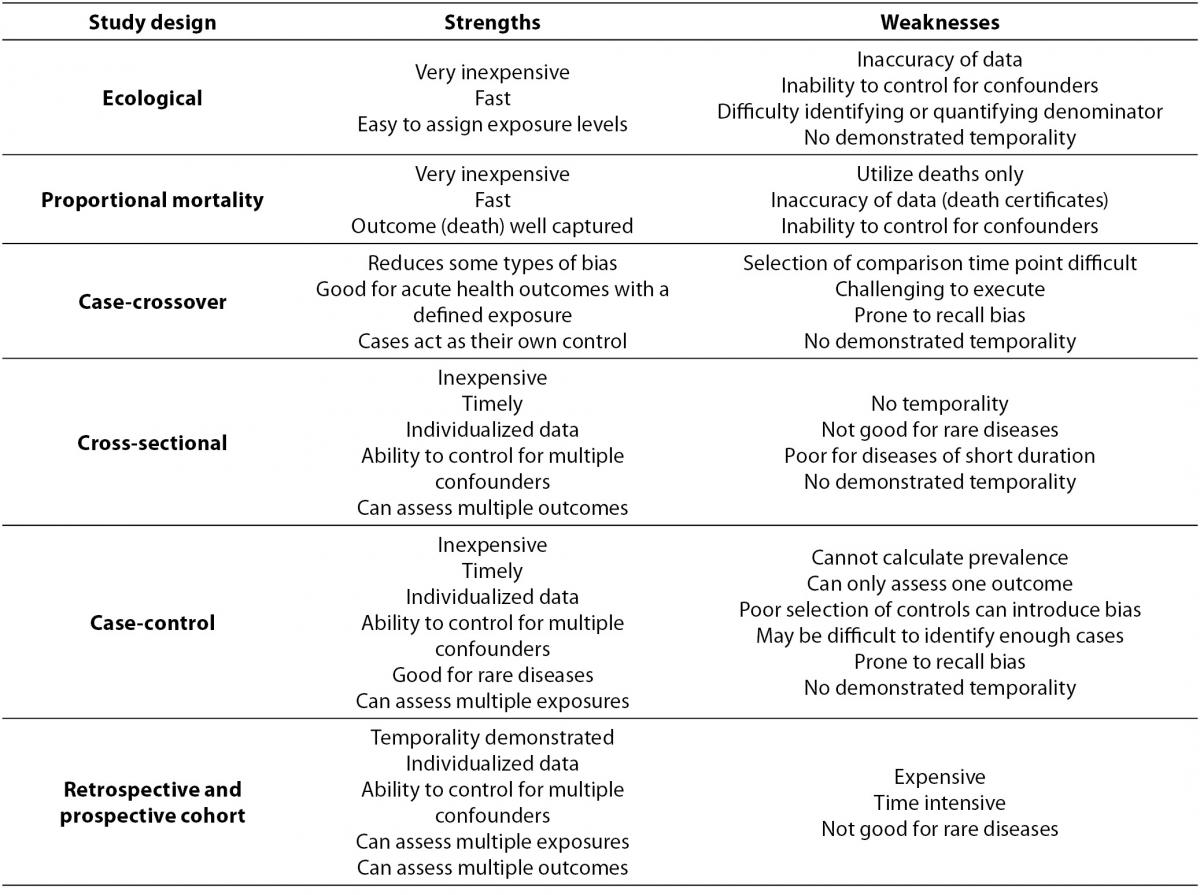
Within primary research there are observational studies and interventional studies. Observational studies, also called epidemiological studies, are those where the investigator is not acting upon study participants, but instead observing natural relationships between factors and outcomes. Diagnostic studies are classified as observational studies, but are a unique category and will be discussed independently. Interventional studies, also called experimental studies, are those where the researcher intercedes as part of the study design. Additionally, study designs may be classified by the role that time plays in the data collection, either retrospective or prospective. Retrospective studies are those where data are collected from the past, either through records created at that time or by asking participants to remember their exposures or outcomes. Retrospective studies cannot demonstrate temporality as easily and are more prone to different biases, particularly recall bias. Prospective studies follow participants forward through time, collecting data in the process. Prospective studies are less prone to some types of bias and can more easily demonstrate that the exposure preceded the disease, thereby more strongly suggesting causation. Table 1 describes the broad categories of observational studies: the disease measures applicable to each, the appropriate measures of risk, and temporality of each study design. Epidemiologic measures include point prevalence, the proportion of participants with disease at a given point in time, period prevalence, the proportion of participants with disease within a specified time frame, and incidence, the accumulation of new cases over time. Measures of risk are generally categorized into two categories: those that only demonstrate an association, such as an odds ratio (and some other measures), and those that demonstrate temporality and therefore suggest causation, such as hazard ratio. Table 2 outlines the strengths and weaknesses of each observational study design.
Table 1. Observational study design measures of disease, measures of risk, and temporality.
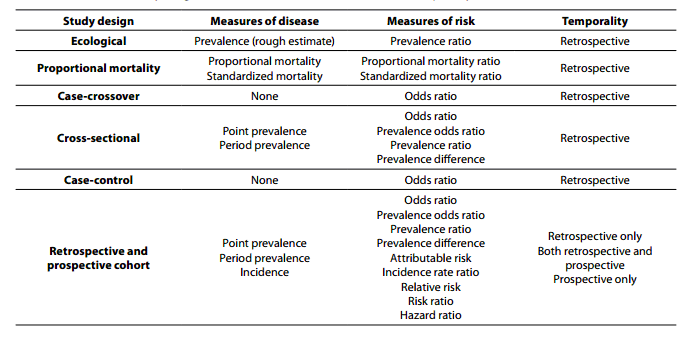
Table 2. Observational study design strengths and weaknesses.
Observational studies
Ecological study design
The most basic observational study is an ecological study. This study design compares clusters of people, usually grouped based on their geographical location or temporal associations (1,2,6,9). Ecological studies assign one exposure level for each distinct group and can provide a rough estimation of prevalence of disease within a population. Ecological studies are generally retrospective. An example of an ecological study is the comparison of the prevalence of obesity in the United States and France. The geographic area is considered the exposure and the outcome is obesity. There are inherent potential weaknesses with this approach, including loss of data resolution and potential misclassification (10,11,13,18,19). This type of study design also has additional weaknesses. Typically these studies derive their data from large databases that are created for purposes other than research, which may introduce error or misclassification (10,11). Quantification of both the number of cases and the total population can be difficult, leading to error or bias. Lastly, due to the limited amount of data available, it is difficult to control for other factors that may mask or falsely suggest a relationship between the exposure and the outcome. However, ecological studies are generally very cost effective and are a starting point for hypothesis generation.
Proportional mortality ratio study design
Proportional mortality ratio studies (PMR) utilize the defined well recorded outcome of death and subsequent records that are maintained regarding the decedent (1,6,8,20). By using records, this study design is able to identify potential relationships between exposures, such as geographic location, occupation, or age and cause of death. The epidemiological outcomes of this study design are proportional mortality ratio and standardized mortality ratio. In general these are the ratio of the proportion of cause-specific deaths out of all deaths between exposure categories (20). As an example, these studies can address questions about higher proportion of cardiovascular deaths among different ethnic and racial groups (21). A significant drawback to the PMR study design is that these studies are limited to death as an outcome (3,5,22). Additionally, the reliance on death records makes it difficult to control for individual confounding factors, variables that either conceal or falsely demonstrate associations between the exposure and outcome. An example of a confounder is tobacco use confounding the relationship between coffee intake and cardiovascular disease. Historically people often smoked and drank coffee while on coffee breaks. If researchers ignore smoking they would inaccurately find a strong relationship between coffee use and cardiovascular disease, where some of the risk is actually due to smoking. There are also concerns regarding the accuracy of death certificate data. Strengths of the study design include the well-defined outcome of death, the relative ease and low cost of obtaining data, and the uniformity of collection of these data across different geographical areas.
Cross-sectional study design
Cross-sectional studies are also called prevalence studies because one of the main measures available is study population prevalence (1-12). These studies consist of assessing a population, as represented by the study sample, at a single point in time. A common cross-sectional study type is the diagnostic accuracy study, which is discussed later. Cross-sectional study samples are selected based on their exposure status, without regard for their outcome status. Outcome status is obtained after participants are enrolled. Ideally, a wider distribution of exposure will allow for a higher likelihood of finding an association between the exposure and outcome if one exists (1-3,5,8). Cross-sectional studies are retrospective in nature. An example of a cross-sectional study would be enrolling participants who are either current smokers or never smokers, and assessing whether or not they have respiratory deficiencies. Random sampling of the population being assessed is more important in cross-sectional studies as compared to other observational study designs. Selection bias from non-random sampling may result in flawed measure of prevalence and calculation of risk. The study sample is assessed for both exposure and outcome at a single point in time. Because both exposure and outcome are assessed at the same time, temporality cannot be demonstrated, i.e. it cannot be demonstrated that the exposure preceded the disease (1-3,5,8). Point prevalence and period prevalence can be calculated in cross-sectional studies. Measures of risk for the exposure-outcome relationship that can be calculated in cross-sectional study design are odds ratio, prevalence odds ratio, prevalence ratio, and prevalence difference. Cross-sectional studies are relatively inexpensive and have data collected on an individual which allows for more complete control for confounding. Additionally, cross-sectional studies allow for multiple outcomes to be assessed simultaneously.
Case-control study design
Case-control studies were traditionally referred to as retrospective studies, due to the nature of the study design and execution (1-12,23,24). In this study design, researchers identify study participants based on their case status, i.e. diseased or not diseased. Quantification of the number of individuals among the cases and the controls who are exposed allow for statistical associations between exposure and outcomes to be established (1-3,5,8). An example of a case control study is analysing the relationship between obesity and knee replacement surgery. Cases are participants who have had knee surgery, and controls are a random sampling of those who have not, and the comparison is the relative odds of being obese if you have knee surgery as compared to those that do not. Matching on one or more potential confounders allows for minimization of those factors as potential confounders in the exposure-outcome relationship (1-3,5,8). Additionally, case-control studies are at increased risk for bias, particularly recall bias, due to the known case status of study participants (1-3,5,8). Other points of consideration that have specific weight in case-control studies include the appropriate selection of controls that balance generalizability and minimize bias, the minimization of survivor bias, and the potential for length time bias (25). The largest strength of case-control studies is that this study design is the most efficient study design for rare diseases. Additional strengths include low cost, relatively fast execution compared to cohort studies, the ability to collect individual participant specific data, the ability to control for multiple confounders, and the ability to assess multiple exposures of interest. The measure of risk that is calculated in case-control studies is the odds ratio, which are the odds of having the exposure if you have the disease. Other measures of risk are not applicable to case-control studies. Any measure of prevalence and associated measures, such as prevalence odds ratio, in a case-control study is artificial because the researcher arbitrarily sets the proportion of cases to non-cases in this study design. Temporality can be suggested, however, it is rarely definitively demonstrated because it is unknown if the development of the disease truly preceded the exposure. It should be noted that for certain outcomes, particularly death, the criteria for demonstrating temporality in that specific exposure-outcome relationship are met and the use of relative risk as a measure of risk may be justified.
Case-crossover study design
A case-crossover study relies upon an individual to act as their own control for comparison issues, thereby minimizing some potential confounders (1,5,12). This study design should not be confused with a crossover study design which is an interventional study type and is described below. For case-crossover studies, cases are assessed for their exposure status immediately prior to the time they became a case, and then compared to their own exposure at a prior point where they didn’t become a case. The selection of the prior point for comparison issues is often chosen at random or relies upon a mean measure of exposure over time. Case-crossover studies are always retrospective. An example of a case-crossover study would be evaluating the exposure of talking on a cell phone and being involved in an automobile crash. Cases are drivers involved in a crash and the comparison is that same driver at a random timeframe where they were not involved in a crash. These types of studies are particularly good for exposure-outcome relationships where the outcome is acute and well defined, e.g. electrocutions, lacerations, automobile crashes, etc. (1,5). Exposure-outcome relationships that are assessed using case-crossover designs should have health outcomes that do not have a subclinical or undiagnosed period prior to becoming a “case” in the study (12). The exposure is cell phone use during the exposure periods, both before the crash and during the control period. Additionally, the reliance upon prior exposure time requires that the exposure not have an additive or cumulative effect over time (1,5). Case-crossover study designs are at higher risk for having recall bias as compared with other study designs (12). Study participants are more likely to remember an exposure prior to becoming a case, as compared to not becoming a case.
Retrospective and prospective cohort study design
Cohort studies involve identifying study participants based on their exposure status and either following them through time to identify which participants develop the outcome(s) of interest, or look back at data that were created in the past, prior to the development of the outcome. Prospective cohort studies are considered the gold standard of observational research (1-3,5,8,10,11). These studies begin with a cross-sectional study to categorize exposure and identify cases at baseline. Disease-free participants are then followed and cases are measured as they develop. Retrospective cohort studies also begin with a cross-sectional study to categorize exposure and identify cases. Exposures are then measured based on records created at that time. Additionally, in an ideal retrospective cohort, case status is also tracked using historical data that were created at that point in time. Occupational groups, particularly those that have regular surveillance or certifications such as Commercial Truck Drivers, are particularly well positioned for retrospective cohort studies because records of both exposure and outcome are created as part of commercial and regulatory purposes (8). These types of studies have the ability to demonstrate temporality and therefore identify true risk factors, not associated factors, as can be done in other types of studies.
Cohort studies are the only observational study that can calculate incidence, both cumulative incidence and an incidence rate (1,3,5,6,10,11). Also, because the inception of a cohort study is identical to a cross-sectional study, both point prevalence and period prevalence canbe calculated. There are many measures of risk that can be calculated from cohort study data. Again, the measures of risk for the exposure-outcome relationship that can be calculated in cross-sectional study design of odds ratio, prevalence odds ratio, prevalence ratio, and prevalence difference can be calculated in cohort studies as well. Measures of risk that leverage a cohort study’s ability to calculate incidence include incidence rate ratio, relative risk, risk ratio, and hazard ratio. These measures that demonstrate temporality are considered stronger measures for demonstrating causation and identification of risk factors.
Diagnostic testing and evaluation study designs
A specific study design is the diagnostic accuracy study, which is often used as part of the clinical decision making process. Diagnostic accuracy study designs are those that compare a new diagnostic method with the current “gold standard” diagnostic procedure in a cross-section of both diseased and healthy study participants. Gold standard diagnostic procedures are the current best-practice for diagnosing a disease. An example is comparing a new rapid test for a cancer with the gold standard method of biopsy. There are many intricacies to diagnostic testing study designs that should be considered. The proper selection of the gold standard evaluation is important for defining the true measures of accuracy for the new diagnostic procedure. Evaluations of diagnostic test results should be blinded to the case status of the participant. Similar to the intention-to-treat concept discussed later in interventional studies, diagnostic tests have a procedure of analyses called intention to diagnose (ITD), where participants are analysed in the diagnostic category they were assigned, regardless of the process in which a diagnosis was obtained. Performing analyses according to an a priori defined protocol, called per protocol analyses (PP or PPA), is another potential strength to diagnostic study testing. Many measures of the new diagnostic procedure, including accuracy, sensitivity, specificity, positive predictive value, negative predictive value, positive likelihood ratio, negative likelihood ratio, and diagnostic odds ratio can be calculated. These measures of the diagnostic test allow for comparison with other diagnostic tests and aid the clinician in determining which test to utilize.
Interventional study designs
Interventional study designs, also called experimental study designs, are those where the researcher intervenes at some point throughout the study. The most common and strongest interventional study design is a randomized controlled trial, however, there are other interventional study designs, including pre-post study design, non-randomized controlled trials, and quasi-experiments (1,5,13). Experimental studies are used to evaluate study questions related to either therapeutic agents or prevention. Therapeutic agents can include prophylactic agents, treatments, surgical approaches, or diagnostic tests. Prevention can include changes to protective equipment, engineering controls, management, policy or any element that should be evaluated as to a potential cause of disease or injury.
Pre-post study design
A pre-post study measures the occurrence of an outcome before and again after a particular intervention is implemented. A good example is comparing deaths from motor vehicle crashes before and after the enforcement of a seat-belt law. Pre-post studies may be single arm, one group measured before the intervention and again after the intervention, or multiple arms, where there is a comparison between groups. Often there is an arm where there is no intervention. The no-intervention arm acts as the control group in a multi-arm pre-post study. These studies have the strength of temporality to be able to suggest that the outcome is impacted by the intervention, however, pre-post studies do not have control over other elements that are also changing at the same time as the intervention is implemented. Therefore, changes in disease occurrence during the study period cannot be fully attributed to the specific intervention. Outcomes measured for pre-post intervention studies may be binary health outcomes such as incidence or prevalence, or mean values of a continuous outcome such as systolic blood pressure may also be used. The analytic methods of pre-post studies depend on the outcome being measured. If there are multiple treatment arms, it is also likely that the difference from beginning to end within each treatment arm are analysed.
Non-randomized trial study design
Non-randomized trials are interventional study designs that compare a group where an intervention was performed with a group where there was no intervention. These are convenient study designs that are most often performed prospectively and can suggest possible relationships between the intervention and the outcome. However, these study designs are often subject to many types of bias and error and are not considered a strong study design.
Randomized controlled trial study design
Randomized controlled trials (RCTs) are the most common type of interventional study, and can have many modifications (26-28). These trials take a homogenous group of study participants and randomly divide them into two separate groups. If the randomization is successful then these two groups should be the same in all respects, both measured confounders and unmeasured factors. The intervention is then implemented in one group and not the other and comparisons of intervention efficacy between the two groups are analysed. Theoretically, the only difference between the two groups through the entire study is the intervention. An excellent example is the intervention of a new medication to treat a specific disease among a group of patients. This randomization process is arguably the largest strength of an RCT (26-28). Additional methodological elements are utilized among RCTs to further strengthen the causal implication of the intervention’s impact. These include allocation concealment, blinding, measuring compliance, controlling for co-interventions, measuring dropout, analysing results by intention to treat, and assessing each treatment arm at the same time point in the same manner.
Crossover randomized controlled trial study design
A crossover RCT is a type of interventional study design where study participants intentionally “crossover” to the other treatment arm. This should not be confused with the observational case-crossover design. A crossover RCT begins the same as a traditional RCT, however, after the end of the first treatment phase, each participant is re-allocated to the other treatment arm. There is often a wash-out period in between treatment periods. This design has many strengths, including demonstrating reversibility, compensating for unsuccessful randomization, and improving study efficiency by not using time to recruit subjects.
Allocation concealment theoretically guarantees that the implementation of the randomization is free from bias. This is done by ensuring that the randomization scheme is concealed from all individuals involved (26-30). A third party who is not involved in the treatment or assessment of the trial creates the randomization schema and study participants are randomized according to that schema. By concealing the schema, there is a minimization of potential deviation from that randomization, either consciously or otherwise by the participant, researcher, provider, or assessor. The traditional method of allocation concealment relies upon sequentially numbered opaque envelopes with the treatment allocation inside. These envelopes are generated before the study begins using the selected randomization scheme. Participants are then allocated to the specific intervention arm in the pre-determined order dictated by the schema. If allocation concealment is not utilized, there is the possibility of selective enrolment into an intervention arm, potentially with the outcome of biased results.
Blinding in an RCT is withholding the treatment arm from individuals involved in the study. This can be done through use of placebo pills, deactivated treatment modalities, or sham therapy. Sham therapy is a comparison procedure or treatment which is identical to the investigational intervention except it omits a key therapeutic element, thus rendering the treatment ineffective. An example is a sham cortisone injection, where saline solution of the same volume is injected instead of cortisone. This helps ensure that patients do not know if they are receiving the active or control treatment. The process of blinding is utilized to help ensure equal treatment of the different groups, therefore continuing to isolate the difference in outcome between groups to only the intervention being administered (28-31). Blinding within an RCT includes patient blinding, provider blinding, or assessor blinding. In some situations it is difficult or impossible to blind one or more of the parties involved, but an ideal study would have all parties blinded until the end of the study (26-28,31,32).
Compliance is the degree of how well study participants adhere to the prescribed intervention. Compliance or non-compliance to the intervention can have a significant impact on the results of the study (26-29). If there is a differentiation in the compliance between intervention arms, that differential can mask true differences, or erroneously conclude that there are differences between the groups when one does not exist. The measurement of compliance in studies addresses the potential for differences observed in intervention arms due to intervention adherence, and can allow for partial control of differences either through post hoc stratification or statistical adjustment.
Co-interventions, interventions that impact the outcome other than the primary intervention of the study, can also allow for erroneous conclusions in clinical trials (26-28). If there are differences between treatment arms in the amount or type of additional therapeutic elements then the study conclusions may be incorrect (29). For example, if a placebo treatment arm utilizes more over-the-counter medication than the experimental treatment arm, both treatment arms may have the same therapeutic improvement and show no effect of the experimental treatment. However, the placebo arm improvement is due to the over-the-counter medication and if that was prohibited, there may be a therapeutic difference between the two treatment arms. The exclusion or tracking and statistical adjustment of co-interventions serves to strengthen an RCT by minimizing this potential effect.
Participants drop out of a study for multiple reasons, but if there are differential dropout rates between intervention arms or high overall dropout rates, there may be biased data or erroneous study conclusions (26-28). A commonly accepted dropout rate is 20% however, studies with dropout rates below 20% may have erroneous conclusions (29). Common methods for minimizing dropout include incentivizing study participation or short study duration, however, these may also lead to lack of generalizability or validity.
Intention-to-treat (ITT) analysis is a method of analysis that quantitatively addresses deviations from random allocation (26-28). This method analyses individuals based on their allocated intervention, regardless of whether or not that intervention was actually received due to protocol deviations, compliance concerns or subsequent withdrawal. By maintaining individuals in their allocated intervention for analyses, the benefits of randomization will be captured (18,26-29). If analysis of actual treatment is solely relied upon, then some of the theoretical benefits of randomization may be lost. This analysis method relies on complete data. There are different approaches regarding the handling of missing data and no consensus has been put forth in the literature. Common approaches are imputation or carrying forward the last observed data from individuals to address issues of missing data (18,19).
Assessment timing can play an important role in the impact of interventions, particularly if intervention effects are acute and short lived (26-29,33). The specific timing of assessments are unique to each intervention, however, studies that allow for meaningfully different timing of assessments are subject to erroneous results. For example, if assessments occur differentially after an injection of a particularly fast acting, short-lived medication the difference observed between intervention arms may be due to a higher proportion of participants in one intervention arm being assessed hours after the intervention instead of minutes. By tracking differences in assessment times, researchers can address the potential scope of this problem, and try to address it using statistical or other methods (26-28,33).
Randomized controlled trials are the principle method for improving treatment of disease, and there are some standardized methods for grading RCTs, and subsequently creating best practice guidelines (29,34-36). Much of the current practice of medicine lacks moderate or high quality RCTs to address what treatment methods have demonstrated efficacy and much of the best practice guidelines remains based on consensus from experts (28,37). The reliance on high quality methodology in all types of studies will allow for continued improvement in the assessment of causal factors for health outcomes and the treatment of diseases.
Standards of research and reporting
There are many published standards for the design, execution and reporting of biomedical research, which can be found in Table 3. The purpose and content of these standards and guidelines are to improve the quality of biomedical research which will result in providing sound conclusions to base medical decision making upon. There are published standards for categories of study designs such as observational studies (e.g. STROBE), interventional studies (e.g. CONSORT), diagnostic studies (e.g. STARD, QUADAS), systematic reviews and meta-analyses (e.g. PRISMA),as well as others. The aim of these standards and guideline are to systematize and elevate the quality of biomedical research design, execution, and reporting.
Table 3. Published standard for study design and reporting.
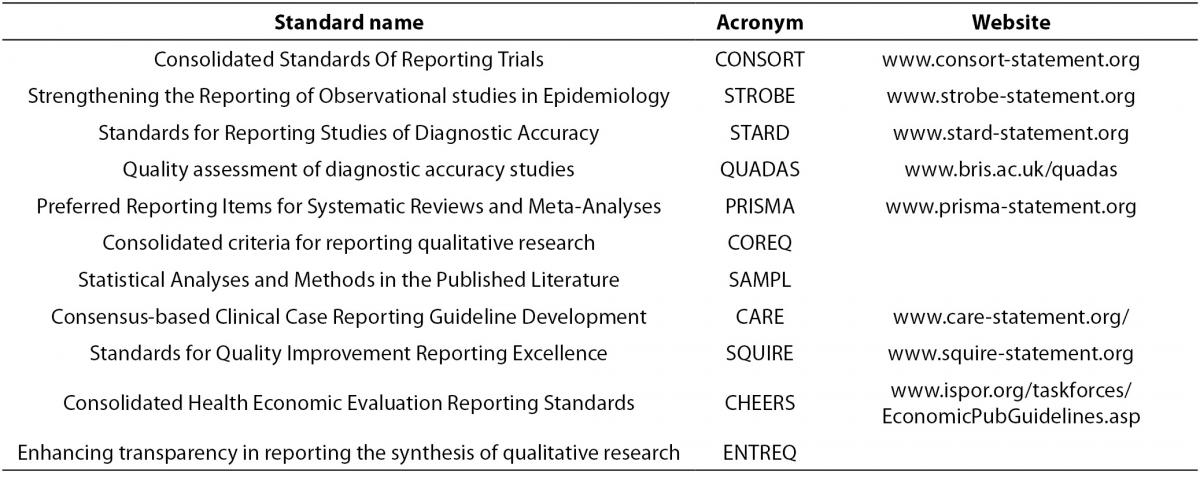
- Consolidated Standards Of Reporting Trials (CONSORT, www.consort-statement.org) are interventional study standards, a 25 item checklist and flowchart specifically designed for RCTs to standardize reporting of key elements including design, analysis and interpretation of the RCT.
- Strengthening the Reporting of Observational studies in Epidemiology (STROBE, www.strobe-statement.org) is a collection of guidelines specifically for standardization and improvement of the reporting of observational epidemiological research. There are specific subsets of the STROBE statement including molecular epidemiology (STROBE-ME), infectious diseases (STROBE-ID) and genetic association studies (STREGA).
- Standards for Reporting Studies of Diagnostic Accuracy (STARD, www.stard-statement.org) is a 25 element checklist and flow diagram specifically designed for the reporting of diagnostic accuracy studies.
- Quality assessment of diagnostic accuracy studies (QUADAS, www.bris.ac.uk/quadas) is a quality assessment of diagnostic accuracy studies.
- Preferred Reporting Items for Systematic Reviews and Meta-Analyses (PRISMA, www.prisma-statement.org) is a 27 element checklist and multiphase flow diagram to improve quality of reporting systematic reviews and meta-analyses. It replaces the QUOROM statement.
- Consolidated criteria for reporting qualitative research (COREQ) is a 32 element checklist designed for reporting of qualitative data from interviews and focus groups.
- Statistical Analyses and Methods in the Published Literature (SAMPL) is a guideline for statistical methods and analyses of all types of biomedical research.
- Consensus-based Clinical Case Reporting Guideline Development (CARE, www.care-statement.org) is a checklist comprised of 13 elements and is designed only for case reports.
- Standards for Quality Improvement Reporting Excellence (SQUIRE, www.squire-statement.org) are publication guidelines comprised of 19 elements, for authors aimed at quality improvement in health care reporting.
- Consolidated Health Economic Evaluation Reporting Standards (CHEERS) is a 24 element checklist of reporting practices for economic evaluations of interventional studies.
- Enhancing transparency in reporting the synthesis of qualitative research (ENTREQ) is a guideline specifically for standardizing and improving the reporting of qualitative biomedical research.
When designing or evaluating a study it may be helpful to review the applicable standards prior to executing and publishing the study. All published standards and guidelines are available on the web, and are updated based on current best practices as biomedical research evolves. Additionally, there is a network called “Enhancing the quality and transparency of health research” (EQUATOR, www.equator-network.org), which has guidelines and checklists for all standards reported in table 3 and is continually updated with new study design or specialty specific standards.
Conclusion
The appropriate selection of a study design is only one element in successful research. The selection of a study design should incorporate consideration of costs, access to cases, identification of the exposure, the epidemiologic measures that are required, and the level of evidence that is currently published regarding the specific exposure-outcome relationship that is being assessed. Reviewing appropriate published standards when designing a study can substantially strengthen the execution and interpretation of study results.