Introduction
Preanalytical variables account for most of laboratory errors and there are many factors that affect and contribute to the results from a patient (1). Quality of a specimen depends of preanalytical variables like specimen collection, physiologic and endogenous interference factors (1,2). Specimen collection variables, such as, duration of fasting, time of specimen collection, posture during blood sampling, the effects of anticoagulants and stabilizing additives used for blood collection can affect biochemical, hematological and coagulation tests results (1,3,4). For some routine biochemical laboratory tests, results can be changed by choice of blood collection tube and storage conditions (3,5,6).
An important component for a laboratory results quality is specimen quality and the time required to obtain a suitable specimen (serum/plasma) (7). Improvement in the turn-around-time (TAT) is very important to clinicians (8). Plasma has advantages of shorter processing time and reduced centrifugation time, but analyte stability is greater in serum (1,9,10). Serum remains stable for extended periods once it has been separated from the clot. Differences in results values between plasma and serum have been documented (9,10). A shortcoming of serum testing is longer clotting time (9,11). Serum tubes should be allowed to clot for minimum 30 minutes to ensure complete clot formation. Blood from patient who are receiving anticoagulant therapy may take longer to clot (12,13).
BD SST II Advance Tube (Becton, Dickinson and Company, Franklin Lakes, NJ, USA) requires a minimum clotting time of 30 minutes prior to centrifugation to obtain serum (9). To provide “plasma advantage”, Becton Dickinson offers the BD RST (Becton, Dickinson and Company, Franklin Lakes, NJ, USA). RST contains a thrombin additive that can provide rapid (five minute) clotting time allowing rapid serum separation and shorter TAT (9,12,13).
The hypothesis of this study was that there is no difference between the tested tubes. The aim was to evaluate the comparability of routine chemistry parameters: glucose (Glu), aspartate aminotransferase (AST), alanine aminotransferase (ALT), total calcium (Ca), lactate dehidrogenase (LD) and potassium (K) in BD RST and reference BD SST II Advance serum tubes. Archived samples (at 4 °C) were further evaluated for analyte stability by retesting for the same analytes after 24 h storage.
Materials and methods
Subjects
The study was conducted between March and May 2013 in a Primary care medical biochemistry laboratory of Primorsko-goranska county health care Rijeka. The total number of samples admitted to our laboratory is 600 per day and 20% of all are samples from patients on oral anticoagulant therapy (OAT). 90 subjects participated in this study. The group consisted of 53 males and 37 females with median age of 48 (range 21-71) years. We included patients on OAT and healthy controls when they had not severe illness or apparent acute inflammatory symptoms, and when they had not used any prescribed medication. Exclusion criteria were history or current cardiovascular, liver or renal disease, diabetes mellitus type 2, malignancies, hemolysed and under filled tubes. This study has institutional ethics approval with informed consent from all participants.
Study design
Venous blood was collected by routine phlebotomy by two expert phlebotomists, according to the recommendations of the Clinical Laboratory Standard Institute (CLSI) (14) in the morning between 7-9 AM in a primary care medical laboratory. Blood was collected using a randomized draw order. According to the CLSI document GP34-A (15) it is necessary to alternately sample the control tube and the tube to be tested. Sampling was done directly into two serum vacuum tubes with clot activator and gel separator: Tube I: SST II Advance® 5.0 mL (lot, 30802088, Becton, Dickinson and Company Franklin Lakes, NJ, USA), Tube II: RST 4.0 mL (lot, 121212, Becton, Dickinson and Company Franklin Lakes, NJ, USA). Tubes were filled to capacity. Both tubes were gently inverted to mix the additive/clot activator evenly with blood. RST tubes were mixed by five complete inversions and SST II Advance tubes mixed by six complete inversions immediately after collection according to the manufacturer’s instructions. Tubes were transported from the collection room to the laboratory located two floor above by a single laboratory technician and left in upright position at room temperature (20 °C) to allow blood clotting before centrifugation.
Methods
To determine the clotting time, an empirical visual review of clot formation was taken for some RST and SST tubes (N = 30). Visual observations of clot formation were made by single biochemist. Stop watch was used to measure the clotting time. Tube pairs (RST, SST) were placed side by side in upright position with occasional tilting of the tubes to check on the clot process. Once a firm clot (when approximately 60% of blood clots) was shown, the timer was stopped.
After clot formation, all tubes were centrifuged together at 1500 x g for 10 min at room temperature (according to the manufacturer’s instructions) in a swing bucket centrifuge. Sera from primary tubes were than tested at initial time for six general biochemistry parameters: glucose (Glu), aspartate aminotransferase (AST), alanine aminotransferase (ALT), total calcium (Ca), lactate dehidrogenase (LD) and potassium (K) on the Olympus AU2700 (Beckman Coulter, Tokyo, Japan) according to the manufacturer’s specifications and using original Beckman coulter reagents (Beckman Coulter, Brea, California, USA). All measurements were performed once. Prior to specimen analysis, we run a two level quality control (QC) test using manufacturer’s controls: control serum level 1 (lot 033) and control serum level 2 (lot 034) (Beckman Coulter, Brea, California, USA).
After testing, primary tubes were recapped and then stored for 24 hours at 4 ˚C. The samples were once retested for the same analytes after 24 hours.
Statistical analyses
The normality of distribution of all variables was tested using the Kolmogorov-Smirnov test. Data were described by the mean ± standard deviation (SD) for normal distribution data and median and interquartile range (IQR) for data that did not follow normal distribution. The paired t-test was used for parametric data and the Wilcoxon Matched-Pairs Rank test for non-parametric data to test for statistical differences between analytes measured from the different tubes. Results were analyzed using Passing-Bablok and Bland-Altman plots for association and differences. Level of significance for all statistical comparisons was set as P < 0.05. The biases from tubes were compared with the current desirable allowable bias based on biological variation (16) according to the formula B < 0.25 (CVw2 + CVg2)1/2 where the CVw is within-subject biological variation and CVg is the between-subject biological variation (17). The biases for each tube were calculated according to the formula: mean difference (%) = [(test tube mean-reference tube mean/reference tube mean) x 100]. The arithmetic mean of these results represents mean difference. Statistical analyses were performed using MedCalc 12.7.0.0. statistical software (MedCalc Software, Mariakerke, Belgium).
Results
As shown in table 1, clotting process was significantly shorter in the RSTs compared to SSTs (P < 0.001). In the RSTs, blood of all participants clotted within 9 minutes, while in the SSTs clotted within 51 minutes.
The summary statistics results for evaluation of tested RST against reference SST II Advance tubes for six routine chemistry tests results at initial time are shown in table 2. Parallel mean tests results for AST, ALT and potassium for RSTs were in close agreement with that of the reference (SST) tube. There was a statistically significant difference (P < 0.001) between the tubes for glucose, calcium and LD. Difference for glucose and LD was also clinically significant compared with the current desirable allowable bias based on biological variation. Bland-Altman difference plots (Figure 1) showed high mean bias for glucose and LD. Glucose was 3.8% higher in RST tubes than the mean in reference SST II tubes. LD was 5.7 % lower in RST tubes than the mean in reference SST II tubes. Passing-Bablok regression analysis (Figure 2.) showed that for most analytes bias doesn’t exist. However, a constant bias was observed for LD (y= -9.00 (-13.8 to -3.0) + 1.00 (0.96 to 1.02).
Tables 3 and 4 summarize stability studies results. Analyte stability studies showed that in RST tube there was no statistically significant difference for glucose, AST and ALT. Statistically significant difference was observed for calcium (P = 0.006), potassium (P < 0.001) and LD (P < 0.001). However, these differences were not clinically significant; Bland-Altman means bias showed low within-tube mean bias (data not shown). While most of the analytes in SST displayed statistically significant difference (glucose (P = 0.002), AST (P < 0.001), Ca (P < 0.001) and potassium (P < 0.001)), none of them displayed clinical significance.
Table 1. Comparison of clotting time between RST and SST tubes.
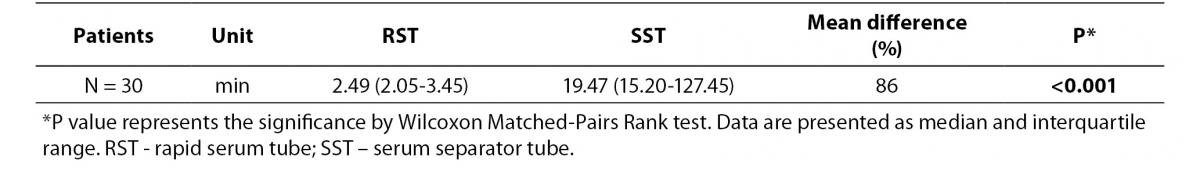
Table 2. Comparison of biochemical parameters between RST and SST tubes.
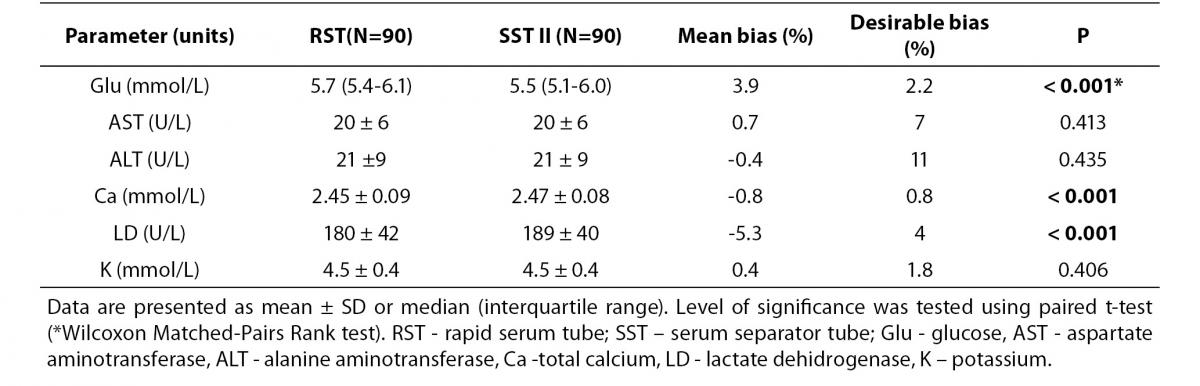
Table 3. Stability of biochemistry analytes in RST tubes (N = 90) after 24 h storage at 4oC.
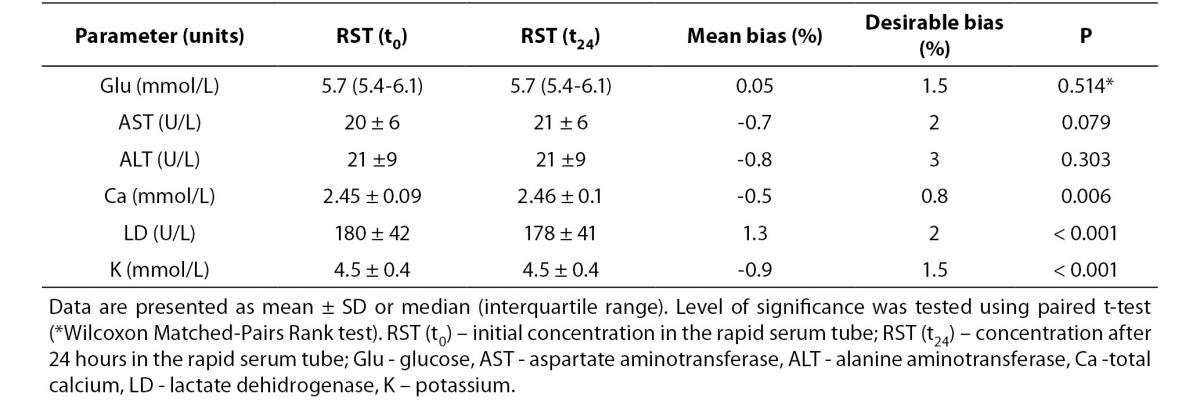
Table 4. Stability of biochemistry analytes SST tubes (N = 90) after 24 h storage at 4oC.
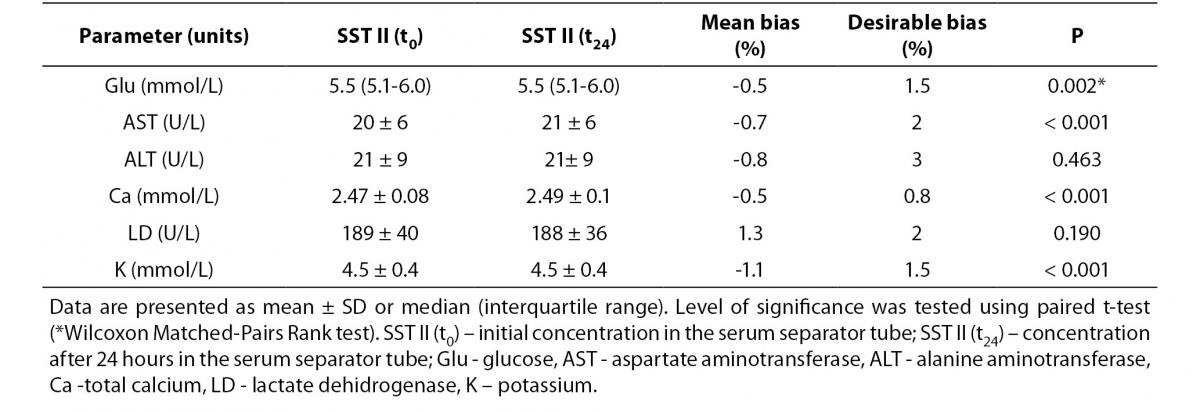
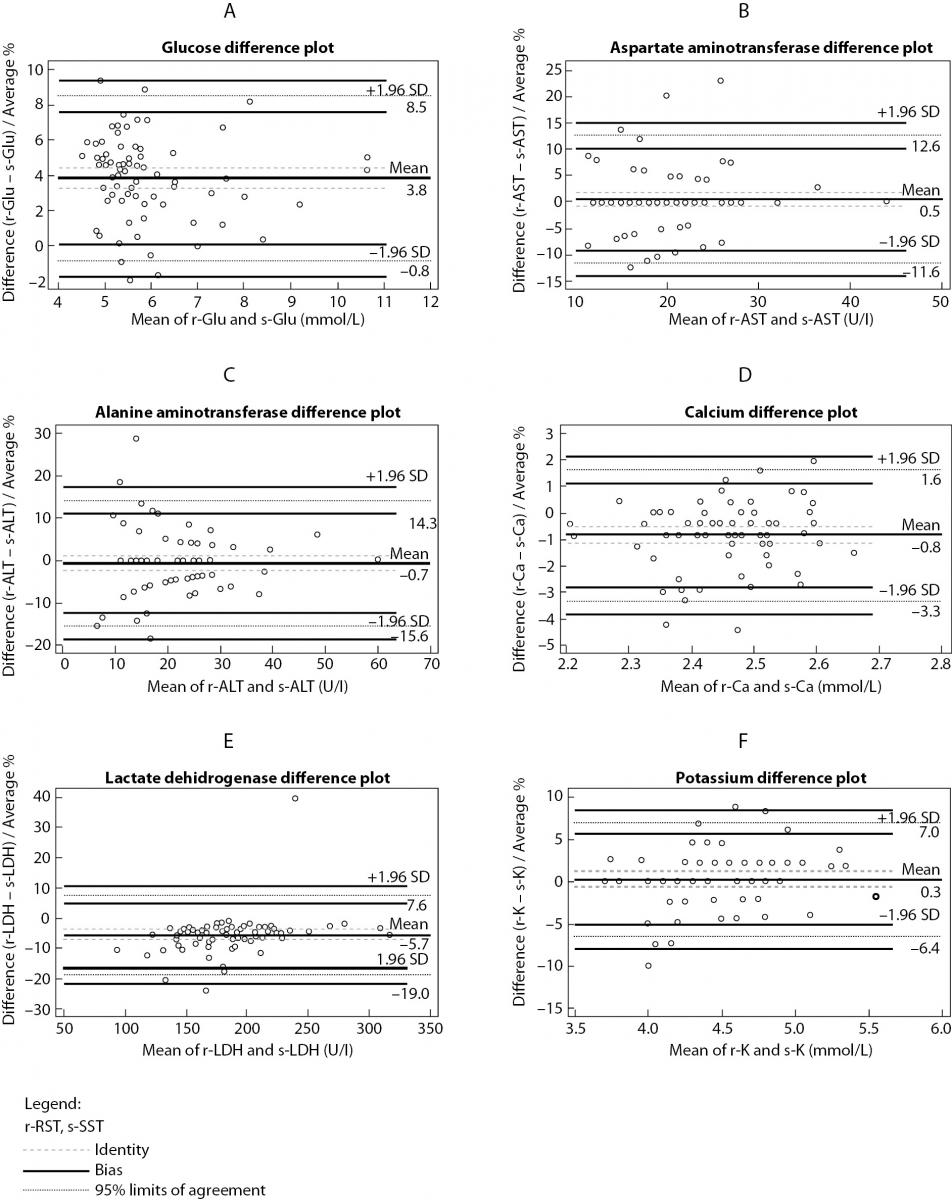
Figure 1. Bland-Altman difference plot between RST and SST tubes for: (a) glucose, (b) aspartate aminotransferase, (c) alanine aminotransferase, (d) calcium, (e) lactate dehidrogenase, (f) potassium.
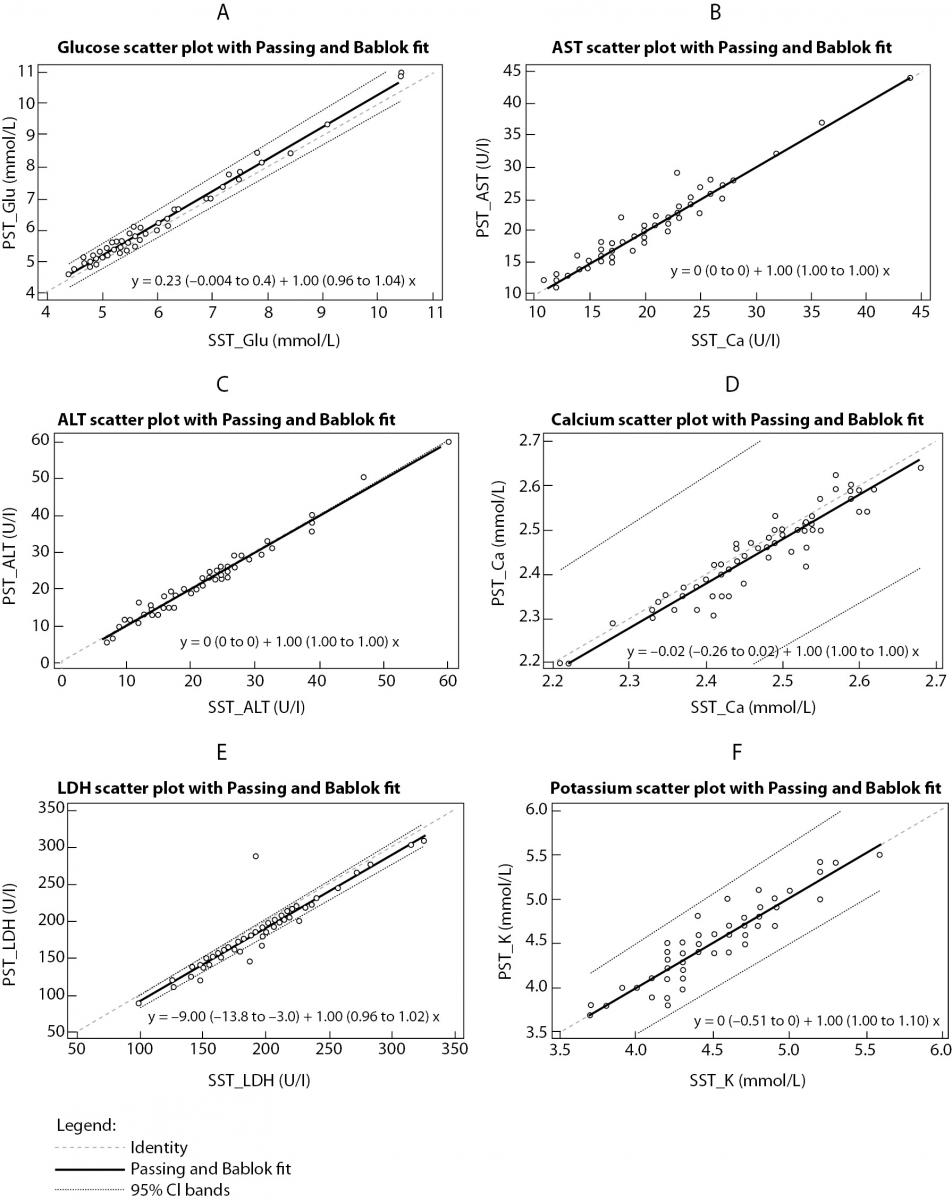
Figure 2. Passing-Bablok regression analysis.
Results comparison between RST and SST tubes for: (a) glucose, (b) aspartate aminotransferase, (c) alanine aminotransferase, (d) calcium, (e) lactate dehidrogenase, (f) potassium.
Discussion
This study evaluated the BD RST tube in a primary care medical laboratory for six routine chemistry analytes. We found that use of this tube represents an improvement over the current SST serum tube for certain parameters. The main findings are: (i) clotting time is significantly shorter in the RSTs compared to SSTs; (ii) significant statistical and clinical difference between the RST tubes related to the SST II tubes for glucose and LD; (iii) all analytes are stable for 24 h storage.
RST provides rapid clotting time allowing rapid serum separation. Visible clotting was achieved rapidly in RST specimens; especially in healthy subjects. Patients receiving anticoagulants have a little longer clotting time ~10 min. According to Dimeski et al. (12) patients on high dose heparin have prolonged clotting time in RST up to 20 min or longer.
Similarities and differences in the concentration of tested analytes measured in RST have been reported previously (7,12,18). In the study of Ng and Yeo (7), no differences in the concentrations of test analytes were observed, while study Dimeski et al. (12) shows the difference in LD activity. They attributed this difference to a faster clotting process which minimizes cell lysis. Also, Huyghe et al. (18) observed that measured serum LD activity was significantly lower among specimens collected in RST than those collected in SST II. As the study of Parenmark and Landberg (19) showed that mixing tubes immediately after venipuncture can increase hemolysis index and that mixing blood samples after venipuncture is not mandatory for all types of tubes (19,20), all hemolysed samples were excluded from our study in order to prevent the influence of hemolysis, although inverting the tubes versus non inverting did not significantly affect LD activity (18). Since incomplete tube filling can affect results tests (significantly higher measured potassium concentration and LD activity) (18), all incompletely filled samples were also excluded.
Differences for glucose in RST have not been reported previously. The possible explanation for higher glucose concentration in the RST tube compared with the SST tube is due to faster clotting, which affects the metabolism of serum glucose in collection tubes. Although according to data from Fernandez et al. (21) and Li et al. (22) serum separator tubes or tubes with a fluoride glycolysis inhibitor may be used for glucose determinations with no difference in reported results.
Analyte stability on serum storage at 4 °C showed no significant difference after 24 h. These findings are similar with results of study Ng and Yeo (7).
The main limitations of this study were the small number of patients and not standardized clotting time measurement.
Our conclusion is that data (except for LD and glucose) obtained in study are comparable between RSTs and SSTs. In addition, RST provides shorter clotting time.
Acknowledgements
In this study the BD RST tubes were provided free of charge by BD diagnostics.