Introduction
Collecting and analyzing data consistently are necessary tasks for assessing quality, monitoring standardized key processes, improving performance and patient safety in clinical laboratories. These influences 70% of medical diagnoses (1,2). Laboratory testing, commonly known as total testing process (TTP), is generally subdivided as preanalytical, analytical and postanalytical phases (3,4). Preanalytical phase errors have been found at the majority of the total errors (46-68.2%) in laboratory and research medicine (5). Unfortunately, according to the literature which comprises the process from the beginning of laboratory test requests to the delivery of specimens in the laboratory, there is no sufficient data on errors during the initial steps of preanalytical phase (6). However, the error magnitude depends on the capacity of a system of error reporting.
Data on rejected samples due to various types of preanalytical errors is one of the laboratory medicine preanalytical quality indicators. There is a set of significant data including various types of errors such as the appropriateness of test order, patient wristband identification error, timing errors in sampling and preparation, hemolytic, lipemic blood samples and inappropriate transport, inadequate and inappropriate tubes portion of the sample (2,7-10). However, the types of error in the preanalytical phase seem to have changed over time, but distribution of errors among other phases of TTP has remained the same (11).
Poor communications among physicians, nurses and phlebotomists involved in the TTP or poorly designed processes are also counted as laboratory errors in preanalytical phase (5).
Preanalytical phase errors start to occur at the point of entry for laboratory test requests by clinicians. Rejection reasons of test requests generally include requests for wrong tests, missing input of tests, ordering a medically unnecessary tests, over-ordering, erroneous coding or unintelligible requests. In some conditions, test requests were rejected with the whole test panel, while only a few tests were selected to be rejected within the clinicians’ request panel. For example: hemolysis interference, one of the most common reasons, especially affects lactate dehydrogenase, aspartate aminotransferase, potassium and total bilirubin concentration, while other tests are not interfered, since it is possible to perform measurement until a severe level of hemolysis (7). Additionally, if test requests cannot appropriate for calculating, these tests are obliged to rejection.
Personal impact on specimen collection is important factor and the preanalytical error rate is 2 to 4 times higher for non-laboratory phlebotomists than laboratory staff (9). Inappropriateness of the samples especially due to blood drawing errors generally occurs when the blood samples are drawn by nurses whose experiences and training are not sufficient for blood drawing in clinics comparing to the phlebotomists who are a group of more stable staff.
The reasons for rejection and their high-level rates might gather into certain tests due to the unique operating characteristics of the test groups during routine work. The aim of this study was to better explain the rates and reasons of rejected samples, regarding to the certain test groups in our laboratory. Their respective rates might provide aid for the planning of the preventive and corrective operations in order to reduce the incidence of these errors.
Materials and methods
Study site
Izmir Ataturk Training and Research Hospital, affiliated with Katip Celebi University Medical School, is an approximately 1,100- bed tertiary care center that serves the Aegean Region of Turkey. It is certified with TS EN ISO 9001:2008 standards by Turkish Standards Institution that is a member of the International Organization for Standardization (ISO). Additionally, the Health Service Quality Standards criteria which had been prepared in consideration with international practices, expertise ideas, strategies and objectives of the Ministry of Health of the Republic of Turkey are applied in our laboratory. Our laboratory serves to inpatients, outpatients and emergency department.
Study design
We performed this study in the time period between February 1, 2012, and January 31, 2013. The six types of laboratory test groups was included: clinical chemistry (3 analyzers: Abbott Architect C-16000; 35 tests such as metabolites, enzymes, electrolytes, lipids etc. included); immunoassays (3 analyzers: Siemens, Advia Centaur XP; 29 tests such as thyroid function tests, fertility hormones, tumor markers etc.); hematology (3 analyzers: Mindray BC 6800; 22 parameters); glycated hemoglobin (HbA1c) (1 analyzer: Adams HA-8180V); coagulation (2 analyzers: ACL TOP 700; 14 tests such as factors, prothrombine time, fibrinogen, D-Dimer etc.) and erythrocyte sedimentation rate (ESR) (2 analyzers: Vacuplus ESR-120), excluding emergency unit data.
This study was a descriptive preliminary study which inappropriateness of samples and test requests were observed. It was designed according to the number of the samples and types of errors for each test group that were previously explained.
The path of the samples
Since there could be problems in the labelling and drawing of the samples, it was necessary to examine how the system worked. Bar-coding identification technology was used in our hospital. A clinician requested tests electronically for a patient in the hospital information system. For inpatients, phelobotomist picked up the requisition and generated barcode labels from the system, properly sticked on pertinent tubes and went to the bedside to check patient’s identification. For outpatients, this procedure was as follows: patient received the appropriate tubes with the barcodes from the staff and gave them to the phlebotomist.
Sample collection tubes
Samples are drawn by routine venipuncture using the order of blood draw as suggested by the Clinical and Laboratory Standards Institute (12).
In this study, Na-citrate vacutainer tubes for coagulation tests and ESR, tubes with gel separator for clinical chemistry and immunoassay tests and K2EDTA tubes for hematology and HbA1c (Becton Dickinson and Company, USA) were used. Then, the specimens were transferred to the laboratory by the trained staff for processing. At the time of sample receipt, technicians visually checked the samples with regard to volume, label, clot and simultaneously matched label with those on the accompanying requisition form and accepted accordingly.
Any inappropriateness was recorded in laboratory information system. The specimens were allowed to clot, centrifuged at 1500 x g for 10 minutes and then delivered to the analyzers.
Methods
Monthly total data were obtained from laboratory and hospital information systems. This was our routine work of quality process monitoring as a proposal of the Ministry of Health of the Republic of Turkey. Then, twelve one-month data were present. Percentage calculations were obtained by ‘number of rejected samples’/ ‘total number of samples’ formula for each laboratory test unit.
This report was created by the hospital information system (HIS) using Probel Computer Software Hardware Co. (Probel Bilgisayar Donanım Şirketi) (Version 1.0, Izmir, Turkey), extracting data from the laboratory information system (ALIS) using an Oracle database. Unfortunately, the only clinical chemistry unit was examined in relation to the status of the patient (inpatient vs. outpatient), because we were constrained to obtain other test group data without separating each other due to measuring specimens by the same analyzer.
Types of inappropriateness
They were evaluated in five groups as follows: total request errors, improperly labelled samples, hemolysed specimen, clotted specimen and insufficient volume of specimens.
Total request error data were obtained from missing the input of tests, unintelligible requests and erroneous coding.
Missing input of tests implied that missing out on ordering the right test. The requests for certain tests (such as LDL cholesterol, globulin, indirect bilirubin, total iron binding capacity) that were necessary to calculate related tests’ concentrations were missing, therefore they could not be calculated for the specimen.
Biochemical properties, half-lives and clinical utility of biochemical tests were useful to evaluate the time frame for unintelligible requests. The only HbA1c test request was automatically limited within 3 months by HIS in our hospital. Then, laboratory staff recorded the test requests that clinician accidentally requested same parameter twice for the same specimen of the same patient, or two clinicians from different departments requested same parameter within the last 4 hours of the current date as unintelligible requests (except HbA1c).
Erroneous coding errors implied that over-ordering of tests or the absence of the specimen while the coding of tests somehow existed in the hospital information system.
Improperly labelled samples were comprised mislabelled or unlabeled samples. If the label did not match the test requisition or if the sample was belonged to a different patient, this situation was considered as misidentification of patient and the sample was recorded as mislabelled, while specimen with no label was recorded as unlabeled. Additionally, the error of swapping the urine and blood sample labels that belonged to the same patient was detected as one of the labelling error according to the feedback from laboratory staff.
Mishandling of specimen caused hemolysed, clotted and insufficient volume of specimens. These blood drawing errors were visually detected by technicians. If there were not any severe changes in colour of the serum, these samples were not rejected, whereas mild colour changes cause rejection of some tests and dark colour causes sample rejection in our laboratory. If there was any clot in the sample or the sample volume was not enough for studying the all tests (mistakes in tube filling, especially, for plasma–citrated samples), these were also rejected.
Statistical analysis
Calculations of rejected specimens for each test group were presented as rate, rate ratios, and percentages. Statistical package for Windows, Version 15.0, SPSS Inc. (Chicago, IL, USA) was used for statistical analysis. The distribution of the ratios for 12 one-month periods was determined using the Shapiro-Wilk normality test. The significant differences of the total rejection rates among test groups were determined by nonparametric Kruskal Wallis test. The significant differences of various types of errors were determined by paired samples t-test for each test group. P value < 0.05 was considered statistically significant for multiple comparisons.
Results
During the 1 year period, a total of 5,183,582 test requests from 1,035,743 blood collection tubes were considered. The total rejection rate for all samples was 0.65% (6,775 / 1,035,743). The total number of samples and the rejection rates of each laboratory test unit are shown in Figure 1. The rejection rate of coagulation group was significantly higher than the other test groups (P < 0.001). The specimen rejection ratio was 16.5 times higher in inpatients than outpatients for routine clinical chemistry test group including all types of errors (2.64% vs. 0.16%, respectively).
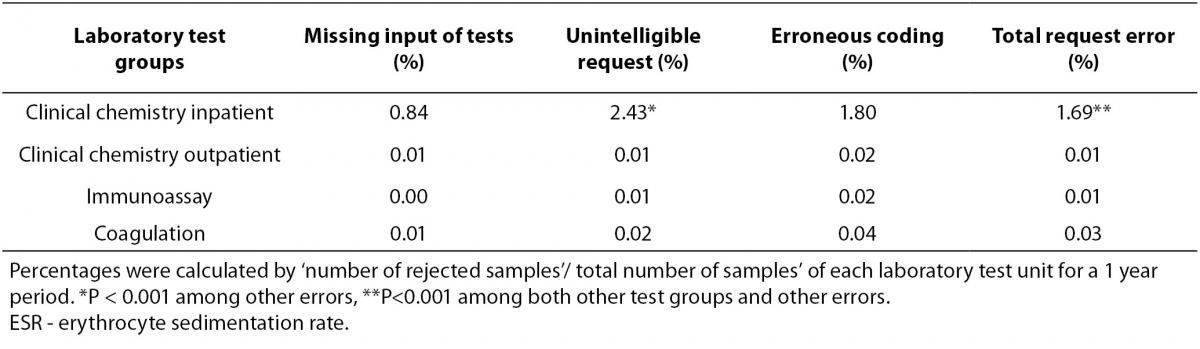
Specimen rejection rates according to the four out of five error reasons of laboratory test groups were presented in Table 1. Rejection rates due to inappropriate test requests were shown in Table 2.
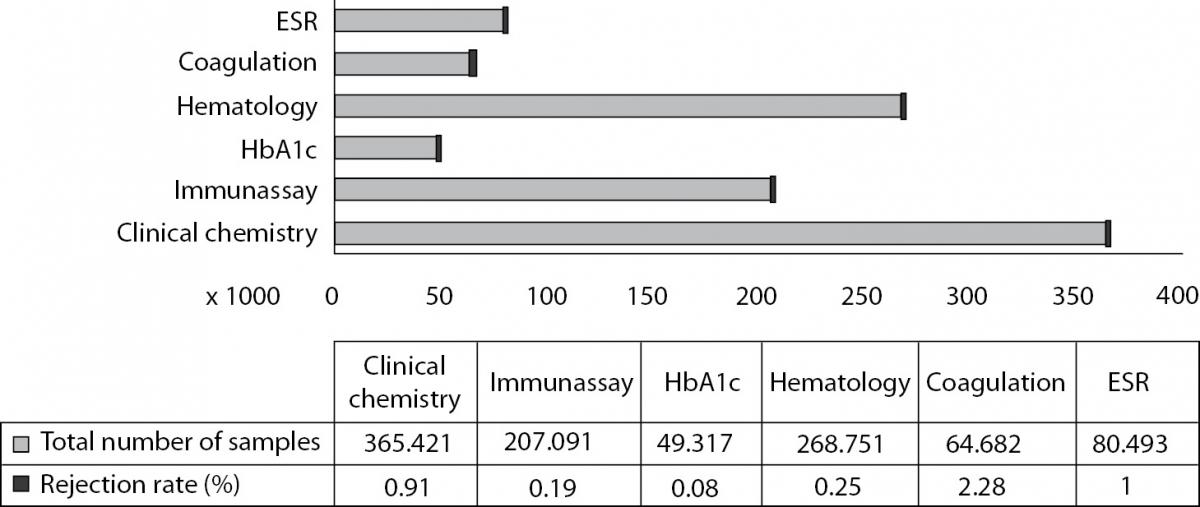
Figure 1. Total number of the samples and rejection rates of each laboratory test units (%). Percentages were calculated as ‘number of rejected samples’/ total number of samples’ of each laboratory test unit. Bars represent actual laboratory data for a 1 year period.
Table 1. Specimen rejection rates according to the error reasons.
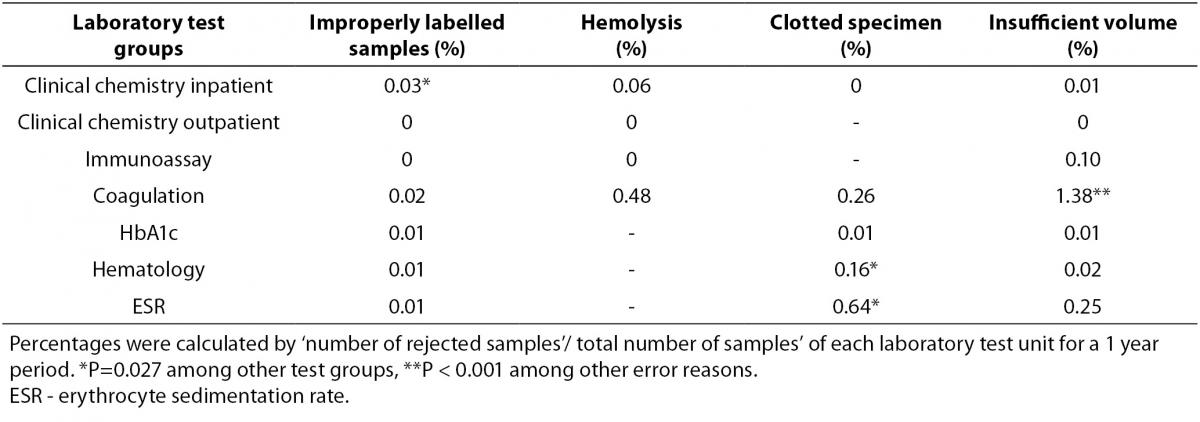
Table 2. Rejection rates due to inappropriate test requests (%).
Although improperly labelled samples are not common, inadequate specimen labelling information in clinical chemistry was observed with the highest ratio in hospitalized patients in this study (P = 0.027).
Rejection rates of blood drawing errors that were hemolysis, clotted specimen and insufficient volume of specimens were found to be 8%, 24% and 34%, respectively among all rejected samples in the study. Hemolysis affected the specimens of inpatients in clinical chemistry and coagulation test groups. The clotted specimen error was seen in ESR, coagulation and hematology. Insufficient volume of specimen error in coagulation was found as the most common rejection cause among other types of errors in our study (P < 0.001). Plasma–citrated samples were used to study for coagulation and ESR groups and exhibited the highest percentage of rejection rate of blood drawing errors (71% of the total rejection number of all test groups), whereas the lowest rate had corresponded to serum samples in clinical chemistry and immunoassay tests (10%). The whole blood-EDTA samples in HbA1c and hematology tests’ ratio was 17%.
In inpatient clinical chemistry groups, total request error rates showed the highest rate both among the other test groups and other causes (P < 0.001). In this group, ‘total request errors /total request errors of all test groups’ ratio was 82% and unintelligible requests were found as the most common rejection cause of the test requests (P < 0.001). Additionally, total request errors were 32% of total rejection number [(total number of request errors / total number of rejections) x 100] according to our study of inpatient clinical chemistry.
Discussion
Among the patient specimens included for a one year period in our study, the rejection rate of coagulation unit had the maximum sample rejection, especially due to insufficient volume of specimen error as the most common rejection cause. Additionally, missing the input of tests, unintelligible requests and erroneous coding were commonly seen as inappropriate test requests in inpatient group.
The majority of the total testing process errors is caused by personal and system-based defects in the preanalytical phase. The development of procedures, training, interdepartmental communication, information technology, and robotics can reduce these errors (3).
Simundic et al. recently reported, in parallel to our study, that the sample error rate differed significantly with respect to the laboratory unit and patient application site (inpatient or outpatient) and the test request errors were most frequent in inpatient routine biochemistry unit (65%) (13).
Carraro et al. performed the study and revealed that the frequency of errors regarding order transmission and hemolysed samples in the preanalytical phase were high. They also concluded that patient misidentification including test requests without patient’s name and failure to check the identity during drawing blood were frequently observed (6).
In the preliminary study on quality indicators, error rates in preanalytical indicators such as erroneous request, erroneous sample, and samples that were not taken were found as 4.1%, 5% and 1.7%, respectively (14).
Ricos et al. reported that error in patient identification during ordering process was 0.08%, incorrect request was 0.1%, lack of collection together with the request in the sampling phase was 7%, redraws were 2%, inconvenient transport conditions were 0.005%, hemolysed samples were 0.2% (15).
In an overview of the results of 4 years of the preanalytical quality control program, the total rejection rate of samples was 0.69%. In the same study, 29% of all rejections were due to hemolysis and 14% to clotted sample. Similar to our study, plasma–citrated samples showed the highest percentage of rejection (1.47%) and the lowest rate was in whole blood-EDTA samples (0.38%) (16).
Comparably to present study, errors of labelling samples using for patient and specimen identification have been reported between 0.01% and 0.03% for clinical chemistry and hematology specimen by the Q-Probes study of the College of American Pathologists (17). The sample rejection rate had been reported ranging from 0.3% to 0.8% in data from multi-center quality monitoring programs (18). Although it was not common, we observed that patients’ labels were changed to each other especially in inpatient specimens. In routine work, printing labels of several patients in the series were prone to more errors. To avoid from these errors, tube barcodes for each patient should have been individually printed and immediately sticked on to the tube. Also, standardized patient label information is very important to decrease errors and to avoid from inaccurate or inadequate information (19). Moreover, delta check is a warning factor for technicians and useful for detecting the misidentification of patients. The urine concentrations were used for some clinical chemistry calculating tests (creatinine clearance etc.). However, phlebotomists accidentally swapped blood and urine barcodes and caused to the rejection of samples as an improper labelling error.
Most of human dependent and preventable preanalytical errors have occurred during sample drawing. Plasma–citrated samples were especially exhibited the highest percentage of rejection rate of blood drawing errors. Coagulation tubes were used in first order of blood draw and more vulnerable to inappropriate mixing and fulfilling of tubes causing to clotted and insufficient volume of specimen errors. These non-conformities could be prevented by phlebotomists’ training.
One of the limitations of our study was that we could only give the results of inpatients for clinical chemistry test group, but not others. Because we have used the analyzers without sample separation according to inpatient or outpatient for the other test groups, we could not give data. Another limitation was that we did not detect and reject test requests which were ordering a medically unnecessary test.
Since 2007, increasing use of automation systems for preanalytical phase also has helped to reduce errors. Because of the rejection of specimen has an effect on repeat behaviour, delay in reporting and finally, missed diagnosis and unnecessary costs, using available published guidelines for a variety of clinical situations and various diseases for screening, diagnosis and treatment to select appropriate tests with respect to the clinical question as a quality indicator is recommended. Improving cooperation with clinicians and giving advice on test selections will be useful to prevent from unintelligible requests and input of added or missing tests (20). Efficient use of health information technology, good laboratory practices, provision of education, feedback, electronic decision- support systems and reminders to clinicians and revisions in requisition forms can contribute to this process and then, will also provide opportunities for corrective actions.
In conclusion, higher ratios of errors were especially attributable to unintelligible requests in inappropriate test requests and improperly labelled samples for inpatient group and blood drawing errors especially due to insufficient volume of specimens in a coagulation test group. The efforts aimed to reduce the rates of rejected samples can provide to improve the quality of laboratory based health care processes. Further studies should be performed after corrective and preventive actions for rejecting samples.
Acknowledgements
The authors wish to thank to the laboratory staff for their technical help.